Gold price climbs above $2,400 as traders bet Fed's sizeable rate-cut
- Gold price hovers near $2,400 as the US Dollar and bond yields correct.
- The Fed is expected to cut interest rates by more than 100 bps this year.
- US Initial Jobless Claims came in lower at 233K from estimates of 240K.

Gold price (XAU/USD) recovers from a two-day and climbs above $2,400 in Thursday’s New York session. The precious metal continues to hold ground due to expectations that the Federal Reserve (Fed) will start reducing interest rates from the September meeting.
Meanwhile, the US Dollar (USD) and bond yields also recovered strongly after the release of the lower-than-expected United States (US) Initial Jobless Claims for the week ending August 2. The US Department of Labor reported that individuals claiming jobless benefits for the first time came in lower at 233K, lower than estimates of 240K and the prior release of 249K.
The US Dollar Index (DXY), which tracks the Greenback’s value against six major currencies, jumps to near three-day high of 103.40. 10-year US Treasury yields bounce back strongly to near 4%. Historically, higher yields on interest-bearing assets bode poorly for non-yielding assets, such as Gold, by increasing the opportunity cost of investment in them. But the Gold price climbs above $2,400 due to firm speculation that the Fed will start reducing interest rates in September.
Daily digest market movers: Gold price gains even them Initial Jobless Claims remain lower-than-expected
- Gold price remains steady on multiple tailwinds. Growing expectations for Fed rate-cut prospects and escalating Middle East tensions have kept the Gold price’s downside limited. The prospects for the Fed’s bulk rate cuts were bolstered by a potential economic slowdown as investors worry that the United States (US) struggles to bear the consequences of higher interest rates.
- According to the CME FedWatch tool, 30-day Federal Funds futures pricing data shows that traders see a 50-basis point (bp) cut in interest rates in September as imminent. The data also suggests that the Fed will reduce its key borrowing rates by more than 100 bps this year. Market speculation for the Fed approaching an aggressive policy stance was prompted by softening labor market conditions, signaled by slower job growth and a rising Unemployment Rate in July.
- While traders priced in aggressive rate-cut announcements by the Fed this year, US economic data has not pointed to a significant slowdown. Though the ISM Manufacturing Purchasing Managers’ Index (PMI) contracted at a faster-than-expected pace in July, activities in the service sector, which accounts for two-thirds of the economy, expanded strongly.
- Commenting on the Services PMI performance, Chris Williamson, chief business economist at S&P Global Market Intelligence, said: “The July surveys are indicative of the economy continuing to grow at the start of the third quarter at a rate comparable to GDP rising at a solid annualized 2.2% pace."
- On the geopolitical front, escalating conflicts between Iran and Israel kept Gold’s safe-haven appeal intact. Saudi Arabia said the killing of the Hamas leader in Tehran is a 'blatant violation' of Iran's sovereignty, Deccan Herald reported. Meanwhile, Israel vowed to eliminate the new Hamas chief, Yahya Sinwar.
US Dollar Price Today:
US Dollar PRICE Today
The table below shows the percentage change of US Dollar (USD) against listed major currencies today. US Dollar was the strongest against the Japanese Yen.
| USD | EUR | GBP | JPY | CAD | AUD | NZD | CHF | |
|---|---|---|---|---|---|---|---|---|
| USD | 0.18% | 0.08% | 0.26% | -0.06% | -0.56% | 0.12% | 0.09% | |
| EUR | -0.18% | -0.09% | 0.10% | -0.26% | -0.74% | -0.07% | -0.12% | |
| GBP | -0.08% | 0.09% | 0.19% | -0.18% | -0.66% | -0.00% | -0.02% | |
| JPY | -0.26% | -0.10% | -0.19% | -0.36% | -0.86% | -0.21% | -0.24% | |
| CAD | 0.06% | 0.26% | 0.18% | 0.36% | -0.49% | 0.18% | 0.15% | |
| AUD | 0.56% | 0.74% | 0.66% | 0.86% | 0.49% | 0.67% | 0.64% | |
| NZD | -0.12% | 0.07% | 0.00% | 0.21% | -0.18% | -0.67% | -0.04% | |
| CHF | -0.09% | 0.12% | 0.02% | 0.24% | -0.15% | -0.64% | 0.04% |
The heat map shows percentage changes of major currencies against each other. The base currency is picked from the left column, while the quote currency is picked from the top row. For example, if you pick the US Dollar from the left column and move along the horizontal line to the Japanese Yen, the percentage change displayed in the box will represent USD (base)/JPY (quote).
Technical Analysis: Gold price aims to stabilize above $2,400
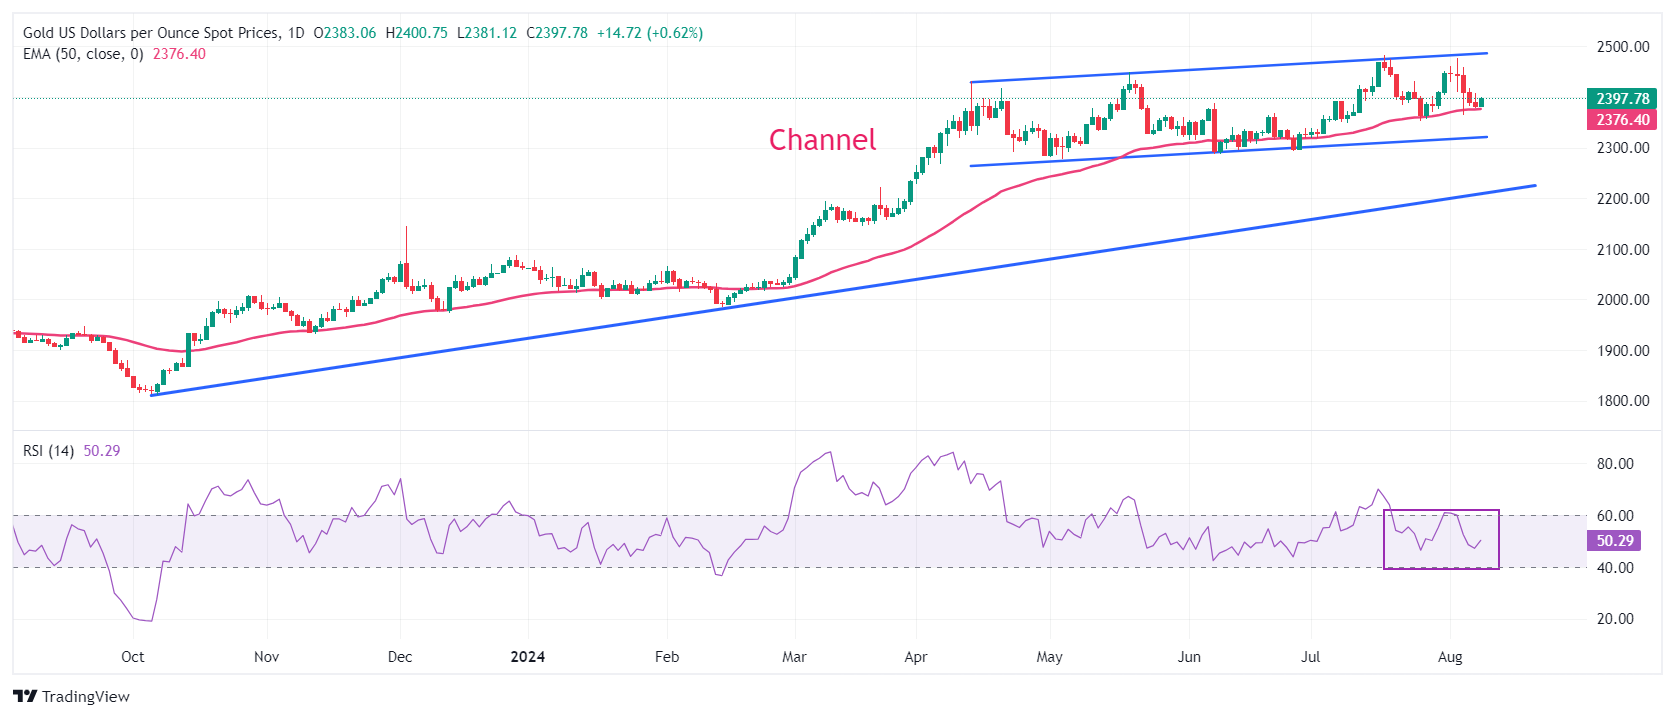
Gold price trades in a channel formation on a daily timeframe, which is slightly rising but broadly exhibited a sideways performance for more than three months. The 50-day Exponential Moving Average (EMA) near $2,370 continues to provide support to the Gold price bulls.
The 14-day Relative Strength Index (RSI) oscillates within the 40.00-60.00 range, suggesting indecisiveness among market participants.
A fresh upside would appear if the Gold price breaks above its all-time high of $2,483.75, which will send it into unchartered territory.
On the downside, the upward-sloping trendline at $2,225, plotted from the October 6 low near $1,810.50, will be a major support in the longer term.
Economic Indicator
Initial Jobless Claims
The Initial Jobless Claims released by the US Department of Labor is a measure of the number of people filing first-time claims for state unemployment insurance. A larger-than-expected number indicates weakness in the US labor market, reflects negatively on the US economy, and is negative for the US Dollar (USD). On the other hand, a decreasing number should be taken as bullish for the USD.
Read more.Last release: Thu Aug 08, 2024 12:30
Frequency: Weekly
Actual: 233K
Consensus: 240K
Previous: 249K
Source: US Department of Labor
Every Thursday, the US Department of Labor publishes the number of previous week’s initial claims for unemployment benefits in the US. Since this reading could be highly volatile, investors may pay closer attention to the four-week average. A downtrend is seen as a sign of an improving labour market and could have a positive impact on the USD’s performance against its rivals and vice versa.
Author

Sagar Dua
FXStreet
Sagar Dua is associated with the financial markets from his college days. Along with pursuing post-graduation in Commerce in 2014, he started his markets training with chart analysis.

















