Gold price oscillates above $1,710, remains lackluster despite weaker DXY
- Gold price is hovering around $1,710.00, downside remains favored on hawkish Western central banks.
- The DXY sees more downside as lower long-run inflation expectations data will remain underpinned.
- The formation of a volatility contraction pattern indicates more consolidation ahead.

Gold price is displaying back and forth moves in a narrow range of $1,710.00-1,715.33 in the Asian session. The precious metal is trading lackluster amid a volatility squeeze. On a broader note, a balanced auction profile can be concluded after considering the price action from the last week. Usually, a volatility contraction is followed by an expansion in the same, and investors should brace for wild moves sooner.
On the dollar front, the US dollar index (DXY) is declining firmly right from the initial tick of the trading session. A bearish open drive structure is indicating a carry-forward of the downside bias in the European session. The DXY will extend its losses after violating Tuesday’s low at 106.40. The asset has surrendered more than 2.60% after printing a fresh 19-year high of 109.30 last week.
Also Read: Gold Price Forecast: XAUUSD remains stuck in a range above $1,700, bearish potential intact
-637938923331471090.jpg)
Fed chair Jerome Powell to announce at least 75 bps rate in July
Gold price seldom has not performed against the weaker greenback
Gold price has turned sideways after printing a low of $1,697.44 last week. Risk-perceived currencies that are compared with the greenback, having the latter as a denominator, are advancing firmly from the past few trading sessions. The greenback turned broadly weak after the US agencies reported the long-run inflation expectations at 2.8%, lower than the prior release of 3.1%. However, the precious metal is displaying a vulnerable performance, which indicates that the gold’s appeal has trimmed significantly.
Lower inflation expectations trim 1% rate hike odds
After the release of the overall Consumer Price Index (CPI) at 9.1% on an annual basis, investors were expecting that the Federal Reserve (Fed) will follow the footprints of the Bank of Canada (BOC) and will paddle up its interest rates by 1% this time. However, the release of the long-run inflation expectations at 2.8% trimmed the 100 basis points (bps) rate hike expectations significantly.
As per CME’s FedWatch Tool, the expectations of a rate hike by 1% were as high as 80% last week, which have trimmed to near 30%. It is worth noting that the intentions of further policy tightening by the Fed are still intact despite the odds of a 1% rate hike have trimmed.
Hawkish central banks to keep the gold price on the tenterhooks
Gold price will remain on the backfoot as Western central banks are extremely hawkish about the benchmark rates. July’s monetary policy minutes released by the Reserve Bank of Australia (RBA) indicate hawkish guidance as inflation expectations for June are sky-rocketing. The European Central Bank (ECB) is discussing the extent of the interest rate to be announced for the first time in 11 years. The majority of Fed policymakers are betting on an interest rate hike by at least 75 bps in its July monetary policy. Apart from that, the Bank of England (BOE) is expected to announce a consecutive 50 bps rate hike next week.
-637938926300989391.png)
Vulnerable oil prices in July to barricade price pressures
The DXY is expected to continue its downside rush on a broader note as the market participants are expecting that inflation has reached its potential. Oil prices have remained vulnerable in the month of July and lower valued ‘paychecks’ received by the households have forced them to drop their consumption quantity-wise. A slippage in overall demand and oil-driven inflation will result in a lower inflation rate.
Gold technical analysis
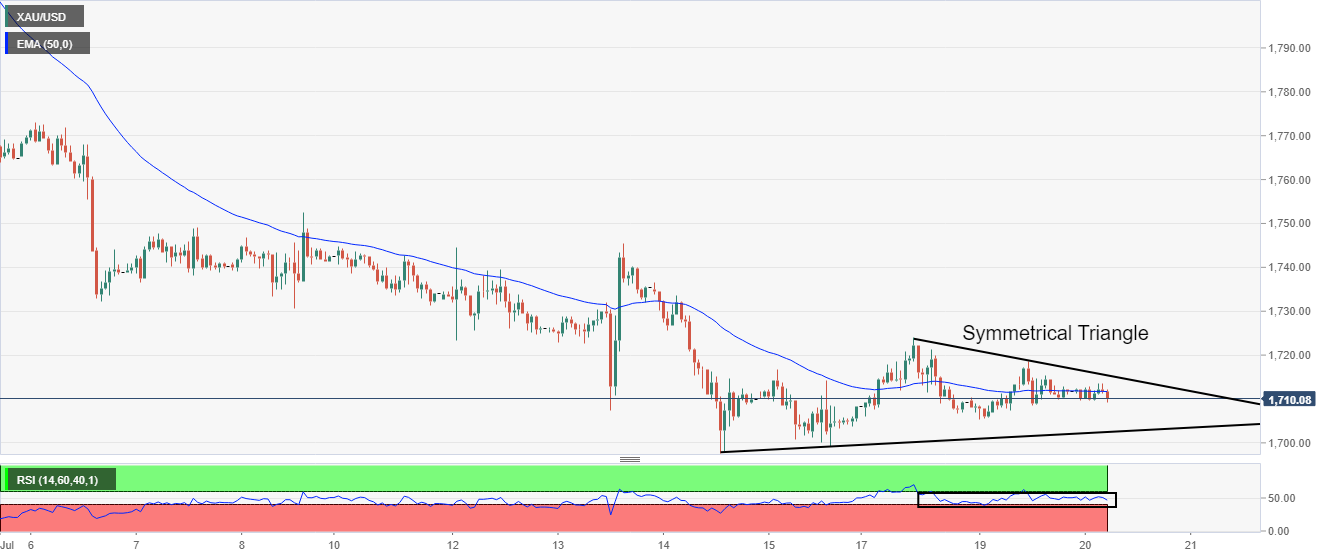
Gold price is auctioning in a Symmetrical Triangle chart pattern that signals a slippage in volatility followed by an expansion in the same. The upward-sloping trendline of the above-mentioned chart pattern is placed from July 14 low at $1,697.69 while the downward-sloping trendline is plotted from July 18 low at $1,723.97.
The 50-period Exponential Moving Average (EMA) at $1,712.00 is overlapping with the gold prices, which signals a consolidation ahead.
Also, the Relative Strength Index (RSI) (14) is oscillating in the 40.00-60.00 range, which indicates that investors are awaiting a potential trigger for further guidance.
Gold hourly chart
Gold halts decline, but bearish risks still intact
Author

Sagar Dua
FXStreet
Sagar Dua is associated with the financial markets from his college days. Along with pursuing post-graduation in Commerce in 2014, he started his markets training with chart analysis.


