Gold Price Forecast: XAUUSD vulnerable amid firmer USD, key levels to watch – Confluence Detector
- Gold Price is extending a two-day bearish momentum on Friday.
- The US dollar reigns supreme as risk-aversion remains at full steam.
- XAUUSD appears vulnerable, with all eyes on next week’s Fed decision.

Gold Price is trading with sizeable losses on the final trading day of the week, as investors continue to seek refuge in the safe-haven US dollar amid persistent fears over rising inflation and a potential recession. Central banks tightening worldwide to quell inflation have re-ignited growth fears. The yellow metal is leaning bearish, despite a minor pullback in the US Treasury yields, as hot inflation and pre-Fed meeting anxiety keep the sentiment around the dollar underpinned.
Also read: Gold Price Forecast: XAUUSD at a critical juncture, US inflation holds the key
Gold Price: Key levels to watch
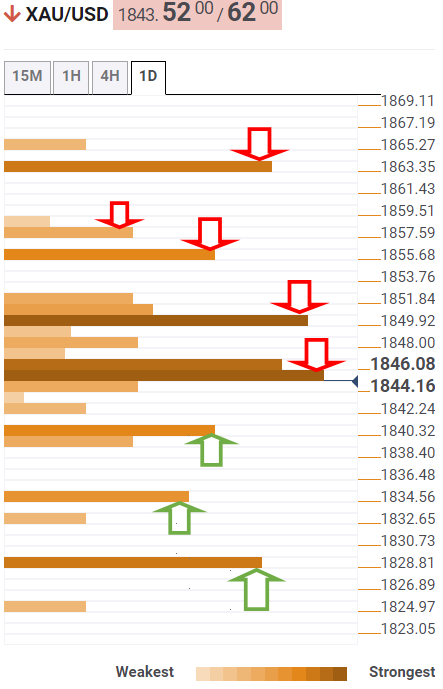
The Technical Confluence Detector shows that Gold Price is teasing support from the crucial daily 200 SMA at $1,842.
A sustained move below the latter will put the previous day’s low of $1,840 at risk. At that level, the daily S1 pivot point and weekly Fibonacci 23.6% retracement merge.
The next relevant downside target is seen at $1,833; the confluence of the monthly Fibonacci 38.2% retracement and the S2 daily pivot point.
The line in the sand for gold buyers is aligned at the intersection of the previous week’s low and the weekly S1 pivot point at $1,829.
On the upside, powerful resistance appears around the $1,845 region, where the 4hr 5 SMA, the daily and weekly Fibonacci 38.2% retracements all coincide.
Further up, bulls will challenge where the daily 5 SMA, the daily Fibonacci 61.8% retracement and the daily 10 SMA converge at $1,850.
Acceptance above the latter will open doors for a fresh advance towards the previous day’s high of $1,855, above which the weekly Fibonacci 61.8% retracement at $1,857 will be probed.
The meeting point of the monthly 61.8% Fibonacci and the daily R2 pivot point at $1,863 will be a tough nut to crack for XAU bulls.
Here is how it looks on the tool
About Technical Confluences Detector
The TCD (Technical Confluences Detector) is a tool to locate and point out those price levels where there is a congestion of indicators, moving averages, Fibonacci levels, Pivot Points, etc. If you are a short-term trader, you will find entry points for counter-trend strategies and hunt a few points at a time. If you are a medium-to-long-term trader, this tool will allow you to know in advance the price levels where a medium-to-long-term trend may stop and rest, where to unwind positions, or where to increase your position size.
Author

Dhwani Mehta
FXStreet
Residing in Mumbai (India), Dhwani is a Senior Analyst and Manager of the Asian session at FXStreet. She has over 10 years of experience in analyzing and covering the global financial markets, with specialization in Forex and commodities markets.

















