- Gold price retreats from two-month highs, awaits US inflation figures.
- USD rebounds with Treasury yields, restricts gold’s bullish momentum.
- Gold price turns bullish on falling bond yields, technical breakout.
Gold price is off the two-month highs but maintains its bullish momentum, as September highs of $1834 remains in sight. Gold price continues to remain underpinned by the market uncertainty over the next policy move by the Fed after Chair Jerome Powell said they are patient on rate hikes a week ago. The bright metal remains at the mercy of the dynamics in the US dollar and the Treasury yields, as investors await the US inflation data for the next direction in gold price.
Read: Gold Price Forecast: XAU/USD seems poised to challenge $1,832-34 supply zone
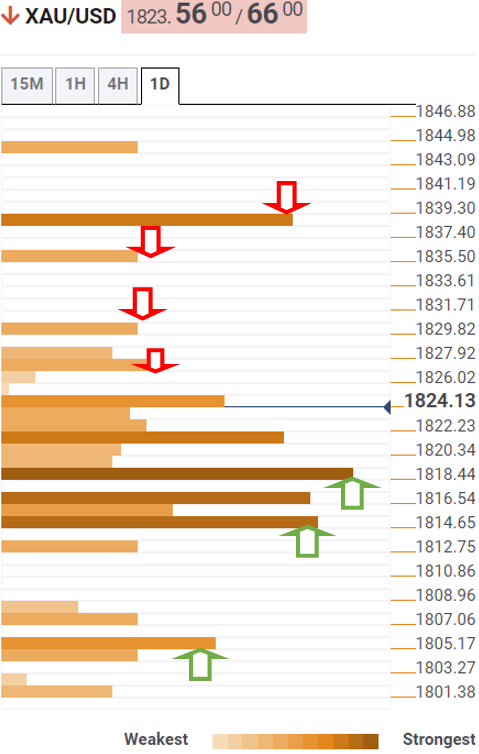
Gold Price: Key levels to watch
The Technical Confluences Detector shows that the latest leg down in gold price is seen testing strong bids at $1822, which is the convergence of the Bollinger Band one-day Upper and Fibonacci 38.2% one-day.
The immediate downside is guarded by the confluence of the previous week’s high and Fibonacci 61.8% one-day at $1818.
If the selling momentum intensifies, then powerful support around $1815 will be put to test. That level is the intersection of the previous month’s high, pivot point one-month R1 and pivot point one-day S1.
Further south, the Fibonacci 23.6% one-week at $1805 will come into play.
On the flip side, buying resurgence could see a fresh rally back towards the two-month tops of $1827, above which the pivot point one-day R1 at $1830 will get probed.
The next bullish target is envisioned at $1834, September highs. The pivot point one-week R1 at $1839 will offer fierce resistance to gold optimists.
Here is how it looks on the tool
About Technical Confluences Detector
The TCD (Technical Confluences Detector) is a tool to locate and point out those price levels where there is a congestion of indicators, moving averages, Fibonacci levels, Pivot Points, etc. If you are a short-term trader, you will find entry points for counter-trend strategies and hunt a few points at a time. If you are a medium-to-long-term trader, this tool will allow you to know in advance the price levels where a medium-to-long-term trend may stop and rest, where to unwind positions, or where to increase your position size.
Information on these pages contains forward-looking statements that involve risks and uncertainties. Markets and instruments profiled on this page are for informational purposes only and should not in any way come across as a recommendation to buy or sell in these assets. You should do your own thorough research before making any investment decisions. FXStreet does not in any way guarantee that this information is free from mistakes, errors, or material misstatements. It also does not guarantee that this information is of a timely nature. Investing in Open Markets involves a great deal of risk, including the loss of all or a portion of your investment, as well as emotional distress. All risks, losses and costs associated with investing, including total loss of principal, are your responsibility. The views and opinions expressed in this article are those of the authors and do not necessarily reflect the official policy or position of FXStreet nor its advertisers. The author will not be held responsible for information that is found at the end of links posted on this page.
If not otherwise explicitly mentioned in the body of the article, at the time of writing, the author has no position in any stock mentioned in this article and no business relationship with any company mentioned. The author has not received compensation for writing this article, other than from FXStreet.
FXStreet and the author do not provide personalized recommendations. The author makes no representations as to the accuracy, completeness, or suitability of this information. FXStreet and the author will not be liable for any errors, omissions or any losses, injuries or damages arising from this information and its display or use. Errors and omissions excepted.
The author and FXStreet are not registered investment advisors and nothing in this article is intended to be investment advice.
Recommended content
Editors’ Picks
EUR/USD stays below 1.0900 as Q1 comes to an end

EUR/USD has lost its traction and declined below 1.0900 in the American session on Friday. Quarter-end flows seem to be allowing the US Dollar find some demand but the risk-positive market environment seems to be limiting the pair's downside ahead of the weekend.
GBP/USD trades below 1.2400, looks to post weekly gains

GBP/USD has edged lower after having tested 1.2400 earlier in the day but remains on track to end the third straight week in positive territory. The upbeat mood remains intact after soft PCE inflation data from the US, making it difficult for the US Dollar to continue to gather strength.
Gold tries to stabilize near $1,980 following earlier spike

Gold price has returned to the $1,980 area following a spike above $1,987 with the initial reaction to lower-than-expected PCE inflation figures from the US. Meanwhile, the benchmark 10-year US Treasury bond yield stays in the red near 3.5%, providing support to XAU/USD.
Will Dogecoin price pull an XRP and rally 60% next week?

Dogecoin price has been in a tight range bound movement since November 22. The recent recovery above the range low looks promising and hints at an explosive move for next week.
Week ahead – Nonfarm payrolls to set the tone for US dollar

With the banking turmoil receding, market participants will turn their attention back to economic releases. The spotlight will fall on the US employment report.