Gold Price Forecast: XAU/USD edges higher within consolidation territory
- Gold remains pressured around weekly low after two-day downtrend.
- Yields, S&P 500 Futures print mild gains but cautious mood ahead of US CPI restricts market moves.
- Omicron, geopolitics act as extra catalysts to watch, US Michigan Consumer Sentiment Index too.
- Gold Price Forecast: Lower in range as caution persists

Update: Gold (XAU/USD) bulls are holding the fort in Asia in familiar territory on the daily chart where the price has been consolidating since the last week of November. At the time of writing, XAU/USD is trading at $1,778.54 and higher by some 0.18% after rising from a low of $1,775.31 to a high of $1,779.69 so far.
The markets were defensive overnight ahead of a very busy central bank schedule next week and the US Consumer Price Index today. The spread of the Omicron variant is a key theme as the uncertainty keeps bonds firm and equity on edge.
US bond yields fell overnight following three consecutive positive days and from the daily perspective, the 10-year yield can sink further to between 1.47% and 1.45%. The two-year government bond yields traded at 0.69%, and the 10-year government bond yields dropped from 1.52% to 1.49%.
''Gold prices are struggling as market pricing for Fed hikes grows more aggressive, as traders pencil in higher odds of a May lift-off,'' analysts at TD Securities explained.
''In this context, the yellow metal has repeatedly failed to remain above the threshold for CTA short covering, which could potentially suggest some noteworthy selling flow has been offered against CTA purchases,'' the analysts added.
''After all,'' they explain, ''sentiment across precious metals remains pervasively negative, as highlighted by months of continued liquidations of ETF holdings as participants brace for the Fed's exit. In this context, while inflation prints are expected to remain elevated into the early months of the new year, suggesting that the market's pricing for Fed hikes could still become more aggressive, we ultimately expect that it will prove to be far too hawkish. In fact, with both an accelerated taper and more than three rate hikes already priced in for 2022, the balance of risks for gold positioning remains to the upside, as geopolitical risks and virus risk could catalyze a positioning reshuffling.''
End of update
Gold (XAU/USD) struggles for clear direction after a two-day downtrend to the weekly low, taking rounds to $1,775 during Friday Asian session. The metal dropped the most in a week the previous day as market sentiment soured while the pre-data anxiety seems to restrict the metal’s latest moves.
Increasing chatters over the Fed’s faster tapering and rate hikes joined mixed updates concerning the South African covid variant, namely Omicron, as well as geopolitical fears surrounding China and Iran, to weigh on the market sentiment the previous day. Firmer US Jobless Claims and Russia-Ukraine tussles were also in the line to roil the mood and drag gold prices.
US Initial Jobless Claims dropped to the lowest levels since 1969, 184K versus 215K expected and 227K forecast, raising odds of the faster tapering by the US Federal Reserve (Fed) ahead of today’s key inflation data and the next week’s Federal Open Market Committee (FOMC) meeting.
On a different page, the return of lockdowns in Europe and the UK, as well as protective measures in parts of the US, renew COVID-19 fears even as global policymakers followed scientists suggesting three vaccine shots as effective against the virus variant. The fears could be linked to the Japanese study saying Omicron is four-time more transmissible than the other covid strains. It’s worth noting that US support to Ukraine and major setbacks for the Beijing Olympics 2022 join the Washington-Israel talks to convey Tehran’s diplomacy to underpin the risk-off mood.
Further, Fitch termed China’s Evergrande as “restricted default” and pushed the People’s Bank of China (PBOC) to raise the reserve requirement ratio (RRR) on banks' foreign currency holdings.
While the US Treasury yields and the Wall Street benchmarks posted losses the previous day, portraying the risk-off mood, the latest corrective pullback in both the risk barometers can’t be taken for market’s optimism amid a light calendar in Asia.
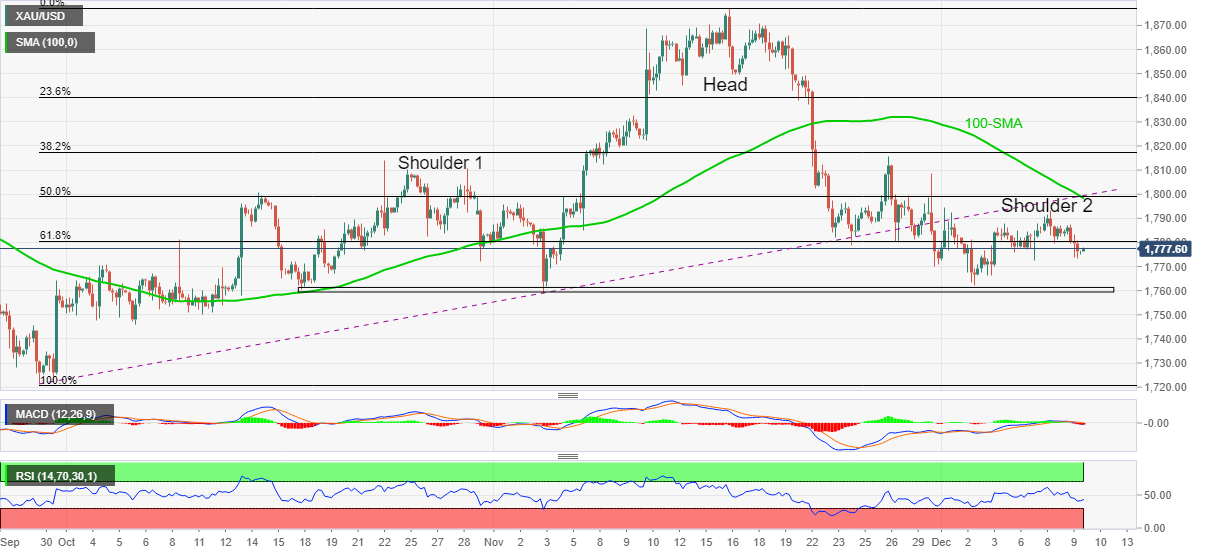
Looking forward, gold traders will pay close attention to the risk-averse catalysts considering the bearish chart pattern, called head-and-shoulders, which in turn highlight today’s US Consumer Price Index (CPI) as the key factor to follow.
Read: US Consumer Price Index November Preview: Inflation is the new cause celebre
Technical analysis
Gold is up for confirming head-and-shoulders bearish chart pattern on the four-hour play, highlighting the $1,760 neckline for the bears. Also favoring the sellers are the MACD signals and RSI retreat.
A clear downside break of $1,760 will theoretically back the slump towards mid-$1600s. However, $1,745 and $1,720 may test the bears before directing them to the $1,700 threshold. Adding to the downside filters is the yearly low of $1,676.
On the contrary, a convergence of the previous support line from late September, 50% Fibonacci retracement (Fibo.) of September 29 to November 16 upside and 100-SMA will challenge the gold buyers around $1,800.
Should the metal prices rise past $1,800, the $1,815, $1,833 and $1,850 levels may entertain gold bulls ahead of November’s peak of $1,877.
To sum up, gold bears are flexing muscles ahead of the key weekly event with eyes on $1,760.
Gold: Four-hour chart
Trend: Further weakness expected
Author

Anil Panchal
FXStreet
Anil Panchal has nearly 15 years of experience in tracking financial markets. With a keen interest in macroeconomics, Anil aptly tracks global news/updates and stays well-informed about the global financial moves and their implications.


