Gold Price Forecast: XAU/USD soars above $2,010 as Fed policymakers see quick US Inflation softening


  • Gold price has climbed above $2,010.00 firmly as Fed policymakers are anticipating a quick deceleration in the US CPI.
  • Fed minutes will be in focus as they will provide a detailed explanation behind the 25 bps rate hike in March.
  • Gold price is marching towards the $2,032.00 resistance after sensing a stellar buying interest.

Gold price (XAU/USD) has shown a quick move above the critical resistance of $2,010.00 in the Asian session. The precious metal has jumped above $2,013.00 amid further weakness in the US Dollar Index (DXY). The USD Index has dropped to near 102.05 and is expected to rampant its downside journey. The downside bias for the USD Index is inspired by expectations of quick deceleration in the United States inflation as anticipated by Federal Reserve (Fed) policymakers.

Philadelphia Fed President Patrick Harker cited “I am keeping an eye on the data to see if more action on inflation is required.” Also, Minneapolis Fed Bank President Neel Kashkari sees inflation at the middle 3% by end of this year, closer to 2% next year.

Apart from them, Chicago Fed President Austan Goolsbee advocated a cautious approach as the combination of tight credit conditions and further restrictive monetary policy can hit sectors and regions differently than if monetary policy was acting on its own.

Wednesday’s US inflation data will be keenly watched as it carries significant value, being the last inflation data before the interest rate decision by the Fed scheduled in first week of May.

Also, Fed minutes will be in focus as they will provide a detailed explanation of hiking rates by 25 basis points (bps) in March.

The demand for US government bonds seems subdued ahead of US inflation data. The return offered on 10-year US Treasury bonds is juggling around 3.43%.

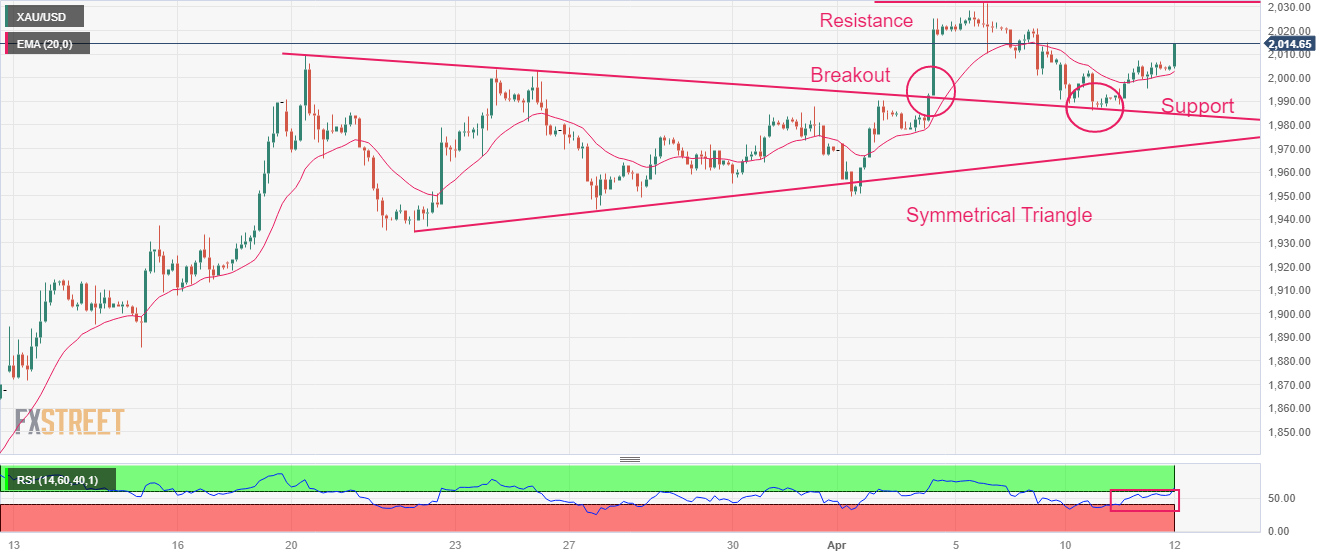
Gold technical analysis

Gold price is marching towards the horizontal resistance plotted from April 05 high at $2,032.00 after sensing a stellar buying interest near the breakout region of the Symmetrical Triangle chart pattern formed on a two-hour scale.

The 20-period Exponential Moving Average (EMA) at $2,004.14 is providing cushion to the Gold bulls.

The Relative Strength Index (RSI) (14) is on the verge of breaking into the bullish range of 60.00-80.00, which will activate the upside momentum.

Gold two-hour chart

XAU/USD

Overview
Today last price 2014.76
Today Daily Change 10.93
Today Daily Change % 0.55
Today daily open 2003.83
 
Trends
Daily SMA20 1973.27
Daily SMA50 1901.75
Daily SMA100 1867.33
Daily SMA200 1789.62
 
Levels
Previous Daily High 2007.52
Previous Daily Low 1988.88
Previous Weekly High 2032.11
Previous Weekly Low 1949.83
Previous Monthly High 2009.88
Previous Monthly Low 1809.46
Daily Fibonacci 38.2% 2000.4
Daily Fibonacci 61.8% 1996
Daily Pivot Point S1 1992.63
Daily Pivot Point S2 1981.44
Daily Pivot Point S3 1973.99
Daily Pivot Point R1 2011.27
Daily Pivot Point R2 2018.72
Daily Pivot Point R3 2029.91


Share: Feed news

Information on these pages contains forward-looking statements that involve risks and uncertainties. Markets and instruments profiled on this page are for informational purposes only and should not in any way come across as a recommendation to buy or sell in these assets. You should do your own thorough research before making any investment decisions. FXStreet does not in any way guarantee that this information is free from mistakes, errors, or material misstatements. It also does not guarantee that this information is of a timely nature. Investing in Open Markets involves a great deal of risk, including the loss of all or a portion of your investment, as well as emotional distress. All risks, losses and costs associated with investing, including total loss of principal, are your responsibility. The views and opinions expressed in this article are those of the authors and do not necessarily reflect the official policy or position of FXStreet nor its advertisers. The author will not be held responsible for information that is found at the end of links posted on this page.

If not otherwise explicitly mentioned in the body of the article, at the time of writing, the author has no position in any stock mentioned in this article and no business relationship with any company mentioned. The author has not received compensation for writing this article, other than from FXStreet.

FXStreet and the author do not provide personalized recommendations. The author makes no representations as to the accuracy, completeness, or suitability of this information. FXStreet and the author will not be liable for any errors, omissions or any losses, injuries or damages arising from this information and its display or use. Errors and omissions excepted.

The author and FXStreet are not registered investment advisors and nothing in this article is intended to be investment advice.

Recommended content


Recommended content

Editors’ Picks

AUD/USD stays defensive near 0.6500 after Australian CPI data

AUD/USD stays defensive near 0.6500 after Australian CPI data

AUD/USD stays defensive near 0.6500 in Wednesday's Asian trading. The Aussie faces headwinds from softer Australian CPI inflation data for May, which fans RBA rate cut expectations. A pause in the US Dollar sell-off undermines the pair despite a better market mood. 

USD/JPY stalls the rebound below 145.00 after Japan's PPI, BoJ headlines

USD/JPY stalls the rebound below 145.00 after Japan's PPI, BoJ headlines

USD/JPY stalls the renewed upside below the 145.00 mark following the release of strong Japanese Services PPI, which supports the case for more BoJ rate hikes despite the mixed BoJ's June Summary of Opinions. Meanwhile, the US Dollar's downside consolidation phase also keeps the pair on the defensive. 

Gold price ticks higher toward $3,350 on weaker US Dollar

Gold price ticks higher toward $3,350 on weaker US Dollar

Gold price is looking to build on the previous day's bounce from sub-$3,300 levels, or over a two-week low, amid the prevalent US Dollar selling bias. However, Powell's hawkish tone could limit deeper USD losses. Furthermore, the Israel-Iran ceasefire optimism might cap the yellow metal.

Circle stock plunges 15%, analysts predict bearish pressure from key long-term headwinds

Circle stock plunges 15%, analysts predict bearish pressure from key long-term headwinds

Circle's CRCL fell to $222 on Tuesday, just a day after its surge to $292, nearly matching Coinbase's market cap. Several analysts predict that CRCL could see a reversal in the long term due to potential interest rate reductions and rising competition. CRCL’s market cap has declined to $54 billion.

Could Iran block the Strait of Hormuz? Why Oil is on edge after US strikes

Could Iran block the Strait of Hormuz? Why Oil is on edge after US strikes

As the Israel-Iran conflict reaches new heights, an old threat is coming back to haunt the markets: that of the closure of the Strait of Hormuz. This narrow arm of the sea in the Persian Gulf, wedged between Iran to the north and the United Arab Emirates and Oman to the south, is much more than a simple sea passage.

The Best brokers to trade EUR/USD

The Best brokers to trade EUR/USD

SPONSORED Discover the top brokers for trading EUR/USD in 2025. Our list features brokers with competitive spreads, fast execution, and powerful platforms. Whether you're a beginner or an expert, find the right partner to navigate the dynamic Forex market.

Forex MAJORS

Cryptocurrencies

Signatures

Best Brokers of 2025