Gold Price Forecast: XAU/USD slips to near $1,960 on hopes that fresh oil cut to keep Fed rates higher
- Gold price has dropped sharply to near $1,960.00 as a surprise production cut by the OPEC+ would propel US Inflation.
- The Fed could keep rates higher for a longer period to bring down fresh persistent inflation.
- A power-pack action in the USD Index would continue ahead of the release of the US ISM Manufacturing PMI data.

Gold price (XAU/USD) is facing immense pressure in early Asia as United States inflationary pressures have propelled after the announcement of a surprise production cut by the OPEC+ on weekend. The precious metal has dropped firmly to near $1,960.00 on hopes that the Federal Reserve (Fed) would keep rates higher for a longer period. Expectations of a fresh impulse in US inflation led by higher oil prices after a sudden production cut are going to phase out odds of a steady monetary policy by the Fed in May.
According to Reuters, the oil cartel will cut the overall oil production by around 1.16 million barrels/day (bpd), which will lead to the overall pledge of production cut to 3.66 million bpd.
The US Dollar Index (DXY) has extended its upside momentum above 102.70 on expectations of the continuation of the 25 basis points (bps) rate hike spell by the Federal Reserve (Fed). This would push interest rates to 5.00-5.25%. S&P500 futures have dropped heavily in early Asia after a decent winning spree, portraying a caution in the overall risk-appetite theme.
A power-pack action in the USD Index would continue ahead of the release of the US ISM Manufacturing PMI data. As per the estimates, the Manufacturing PMI is expected to decline marginally to 47.5 from the former release of 47.7. This could be the fifth consecutive figure below 50.0, which itself is considered a contraction in manufacturing activities.
Apart from that, the Manufacturing New Orders Index will be keenly watched. The economic data provide cues about forward demand for goods, which is likely to contract firmly to 44.6 vs. the prior release of 47.00. Subdued consensus for the US Manufacturing PMI could be the outcome of higher interest rates by the Fed for bringing down persistent inflation.
Gold technical analysis
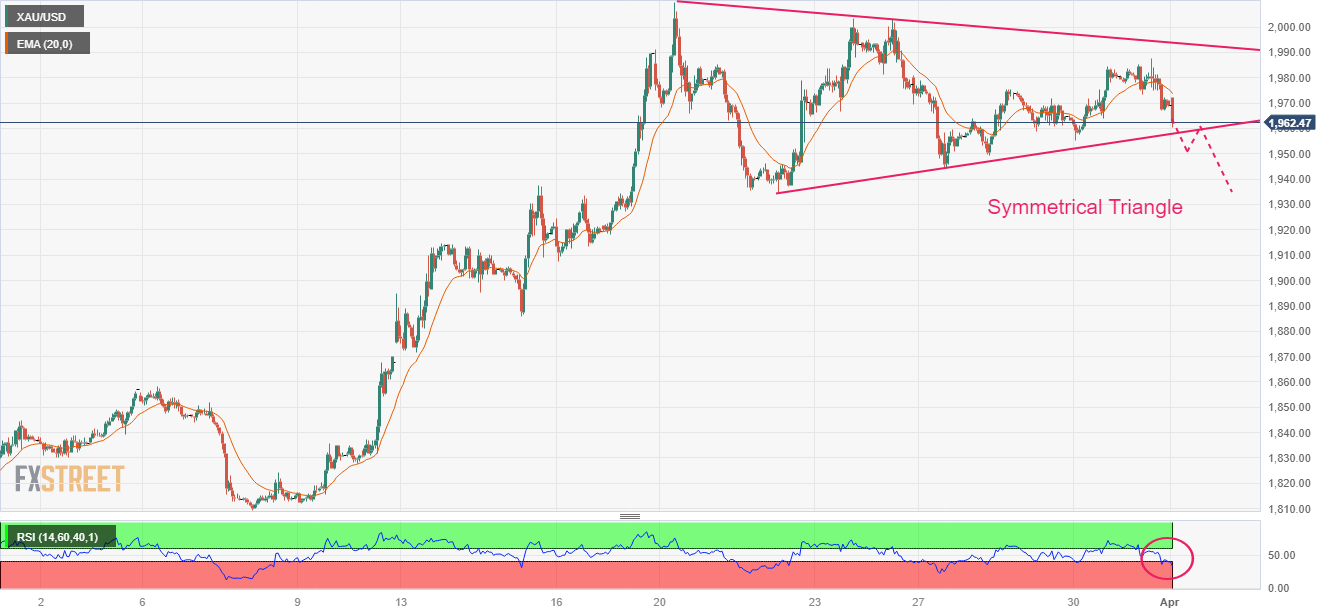
Gold price is hovering near the edge of the upward-sloping trendline of the Symmetrical Triangle chart pattern formed on an hourly scale. The upward-sloping trendline of the chart pattern is plotted from March 22 low at $1,934.34 while the downward-sloping trendline is placed from March 20 high at $2,009.88.
The Gold price has dropped below the 20-period Exponential Moving Average (EMA) at $1,974.10, which indicates that the short-term trend has turned bearish.
Meanwhile, the Relative Strength Index (RSI) (14) has slipped into the bearish range of 20.00-40.00, which indicates more weakness ahead.
Gold hourly chart
Author

Sagar Dua
FXStreet
Sagar Dua is associated with the financial markets from his college days. Along with pursuing post-graduation in Commerce in 2014, he started his markets training with chart analysis.
















