Gold Price Forecast: XAU/USD reversing its technical path (or is it?) despite Bank of Japan surprise move
- Gold price is making tracks to the upside despite the Bank of Japan's surprise relaxation on the yield of its 10-year bonds (JGBs).
- US Dollar sinks as the Yen rallies to the moon.
- US Treasury yields and a hawkish Federal Reserve could be the spanner in the works for the Gold price bulls.

The Gold price is higher on Tuesday due to volatility in the market that has sent the US Dollar lower on the back of a surge in the Japanese Yen following a surprise move by the Bank of Japan (BoJ) in Asian markets.
Gold price rallies on Bank of Japan's surprise move
A decision by Japan's central bank to raise a cap on the yield of its 10-year Japanese government bonds (JGBs) sent markets into a state of shock and lured investors away from US debt. The BoJ is allowing 10-year bonds to trade at interest rates up to 0.5%, up from 0.25% and such a rise in the cap encourages domestic buying of its bonds. However, the Gold price has rallied despite the subsequent lower global borrowing costs and sell-off in bonds across the world, likely as a direct effect of a cheaper US Dollar.
US Dollar is slammed as Yen soars
Nevertheless, the US Dollar has sunk as per the DXY index as the Bank of Japan (BoJ) switches gears which sent the Yen around 5% higher vs the USD. USD/JPY fell from a pre-BoJ high of 137.40 to a low of 130.56. Consequently, the US Dollar as measured against a basket of currencies, including the yen which makes up 13.6% of the basket, fell to a low of 103.77. DXY was trading at a high of 104.90 before the announcement by the BoJ.
US Treasury yields and yield curve in view
With that being said, higher global yields are potentially capping the rally in the Gold price since Gold offers no interest. The benchmark 10-year Treasury note yield rose to 3.710% and two-year note yields rose to 4.312% although they have started to come off their highs.
While Gold price is finding demand in late North American trade, the US Treasury yield curve between two-year and 10-year Treasury notes remains at deeply negative levels, indicating concerns about an impending recession which is commonly positive for the US Dollar.
Federal Reserve sentiment remains key
Going forward, what is going to be critical for the Gold price is the sentiment surrounding the Federal Reserve (Fed). After rising as high as 5.5% after last week’s Federal Open Market Committee (FOMC) meeting, the terminal rate as seen by the swaps market fell back to just below 5.0% despite the hawkish rate hike.
''We cannot understand why the markets continue to fight the Fed,'' analysts at Brown Brothers Harriman said. ''With the exception of some communications missteps here and there, Fed chair Jerome Powell and company have been resolute about the need to take rates higher for longer. Although the media embargo has been lifted, there are no Fed speakers scheduled this week.''
Gold price technical analysis
Prior Gold price analysis:
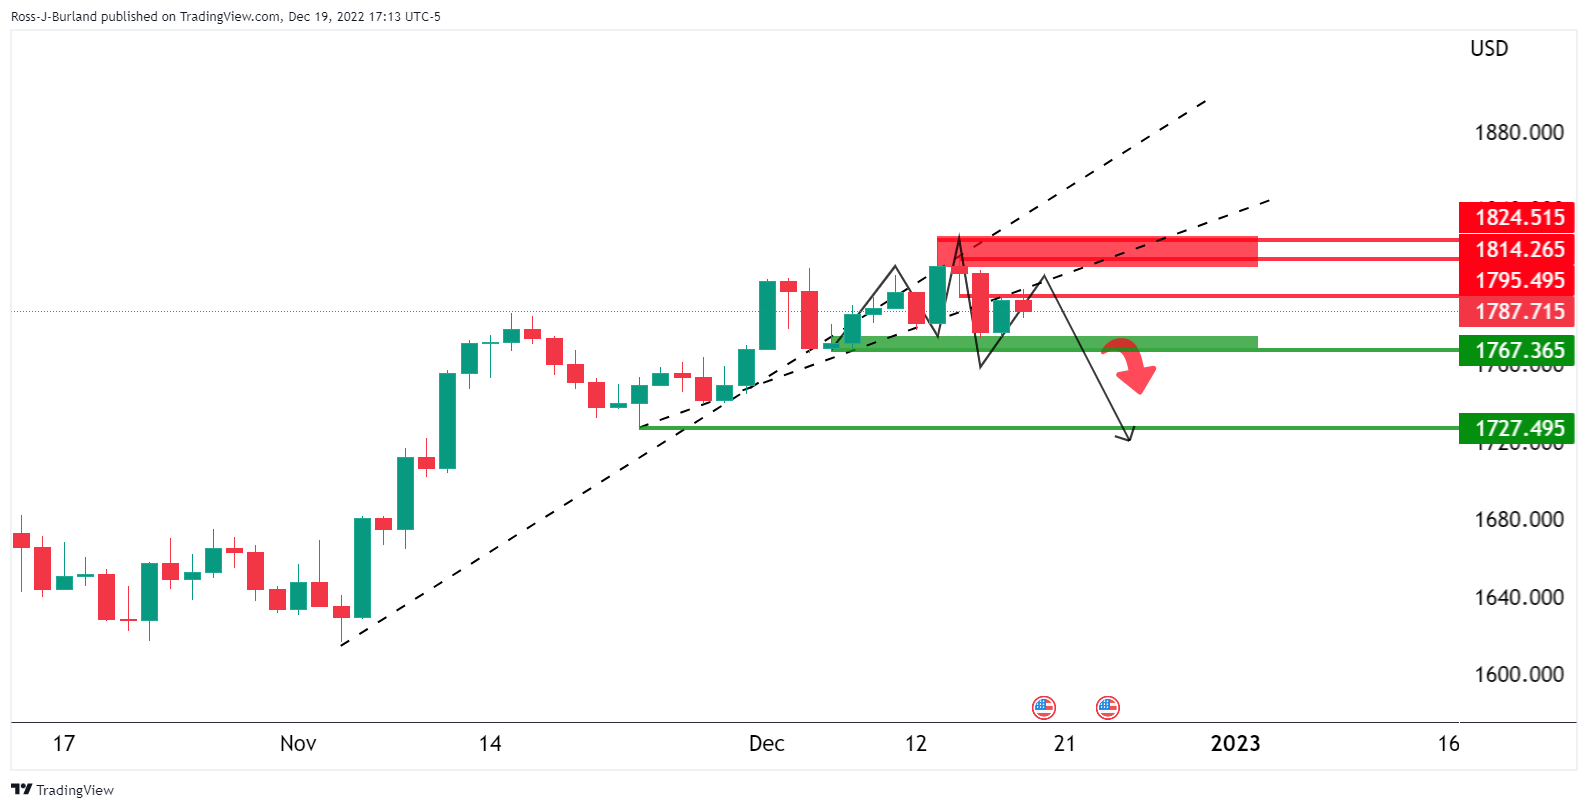
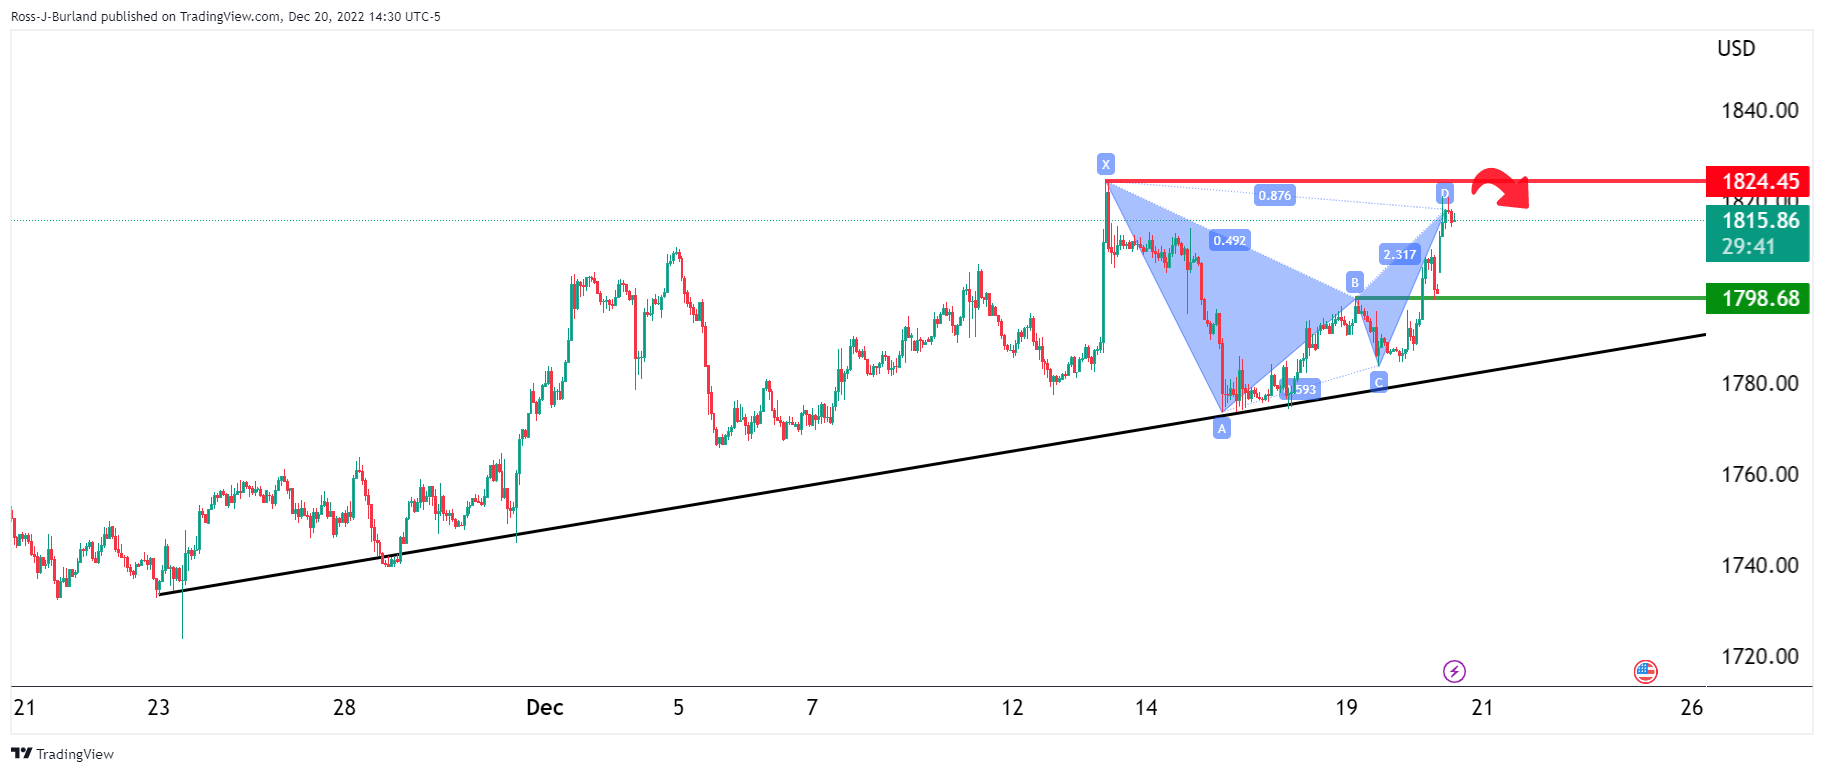
It was stated that the downside bias in Gold price was in play so long as the bulls are kept at bay below the counter trendlines and $1,800. The price has instead rallied on Tuesday and the bales could be turning. However, holiday markets are setting in and it is uncommon for intended momentum trade setups to play out in what are usually choppy conditions for the Gold price.
Gold price update

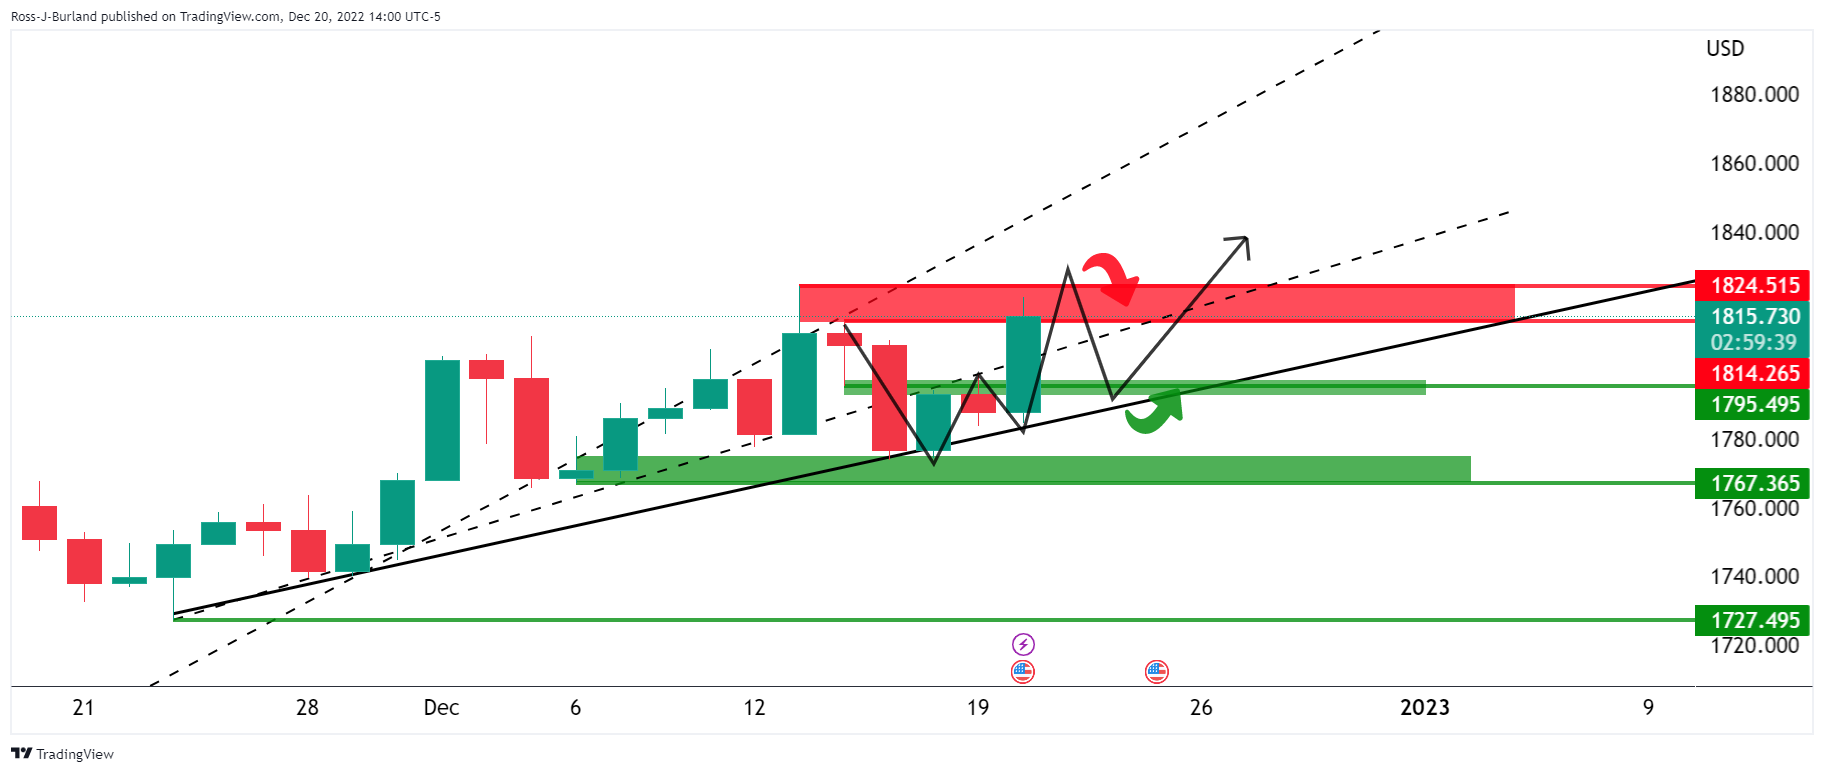
The Gold price has switched bullish as per the move into the $1,800s and bulls are now facing a resistance area.
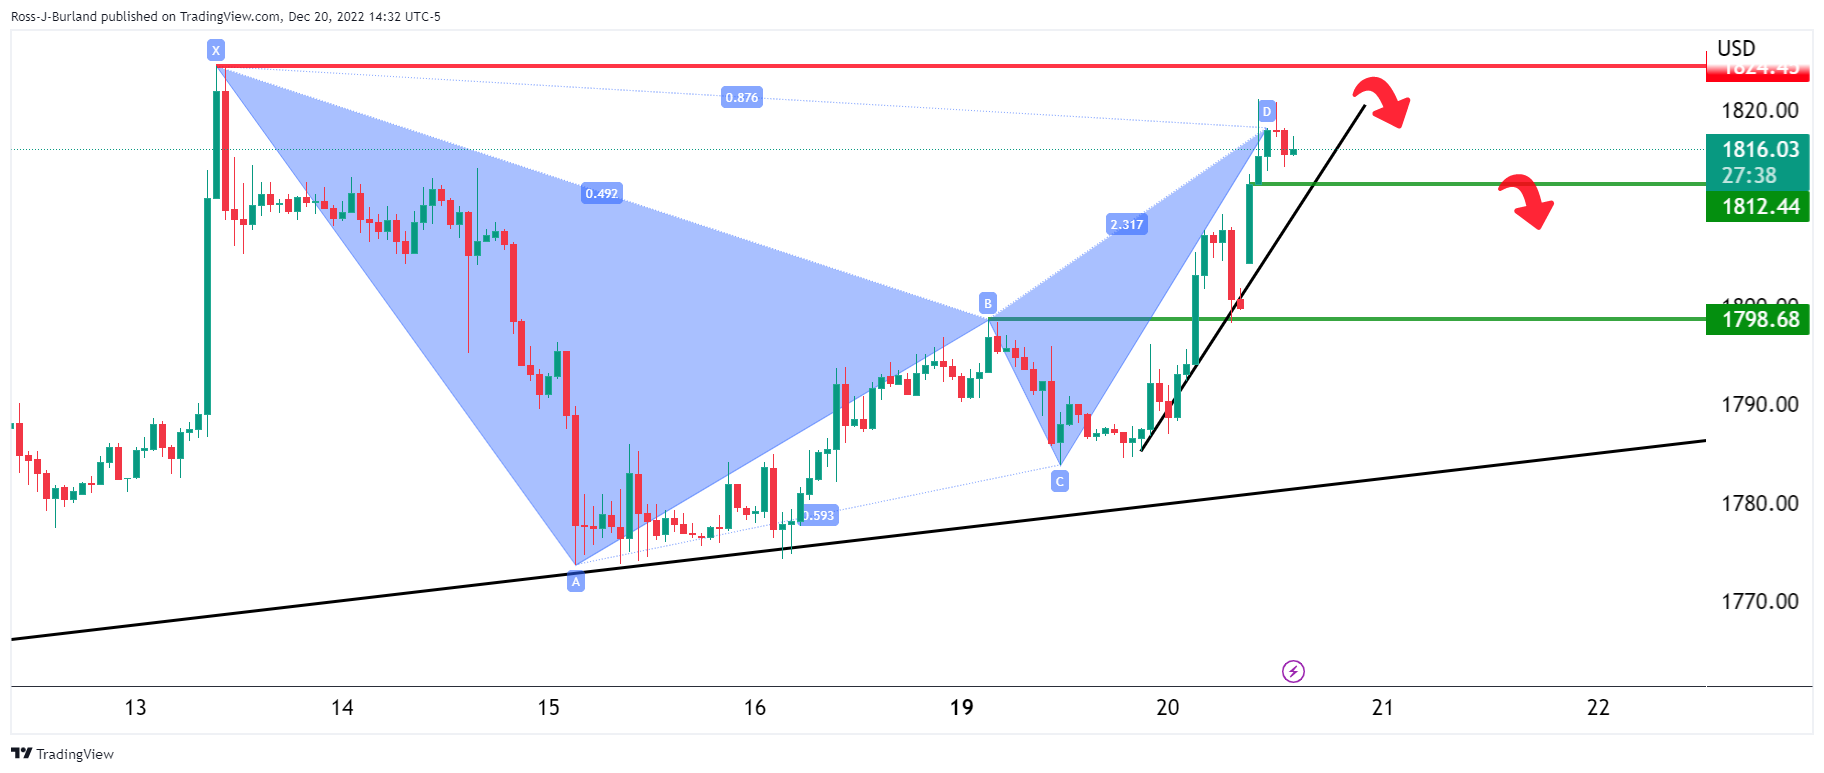
However, Gold price markets do one of three things: 1) Break out, pull back and continue 2) break out pull back and reverse, or 3), break out, pull back and go into a trading range.
Gold price scenario 1:
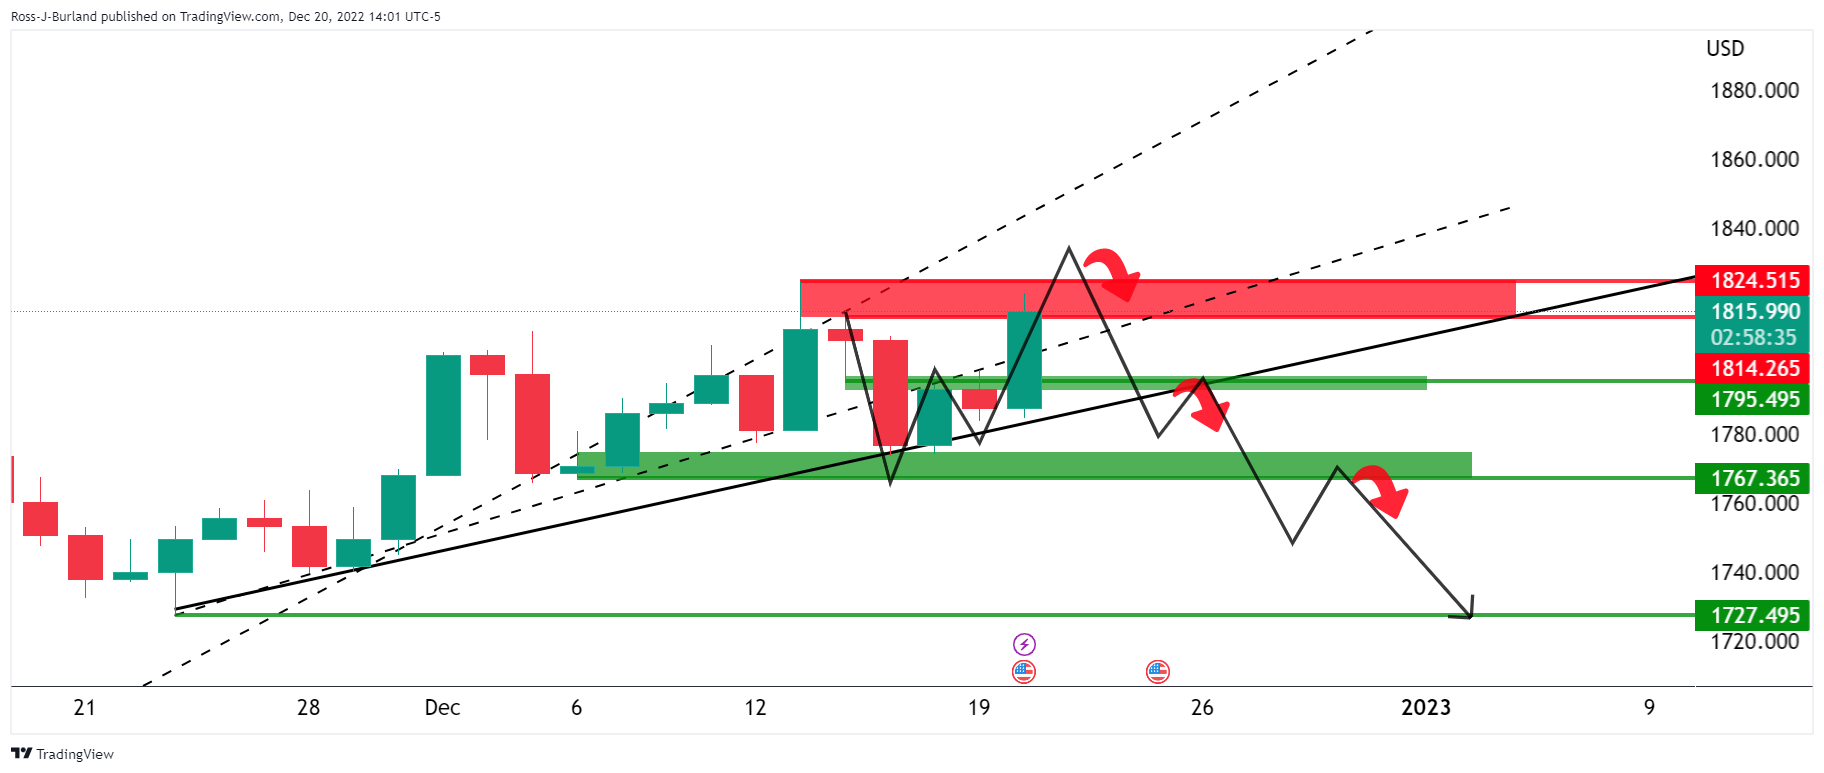
Gold price scenario 2:
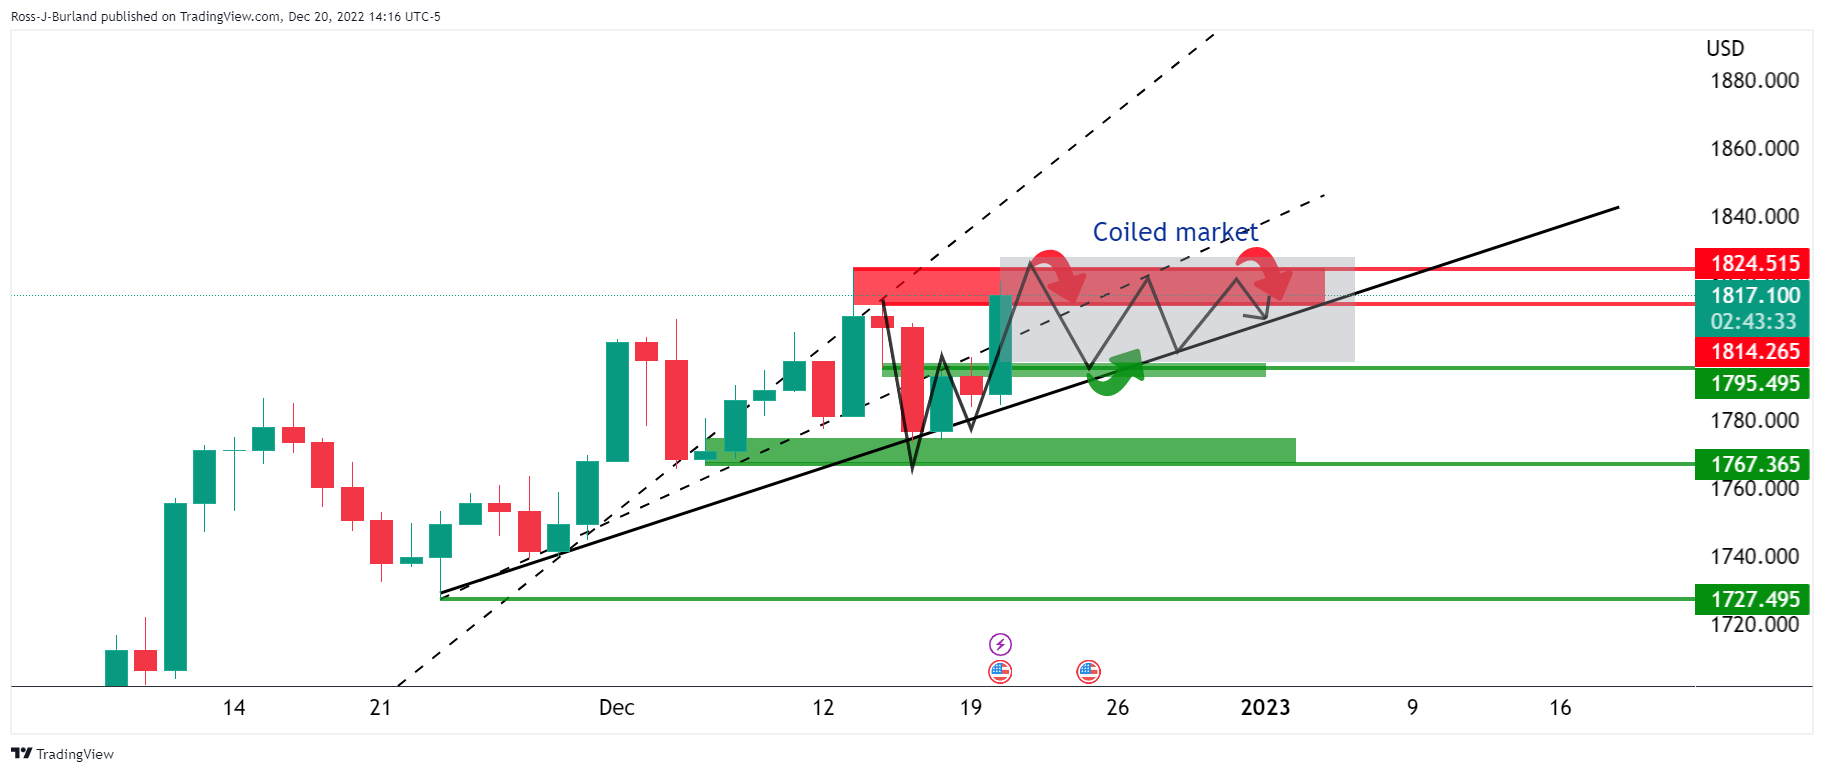
Gold price scenario 3:
Gold price lower time frames
The Gold price 1-hour picture is bearish while below the resistance near $1,825 but not until the Gold price moves to the backside of the micro trend line:
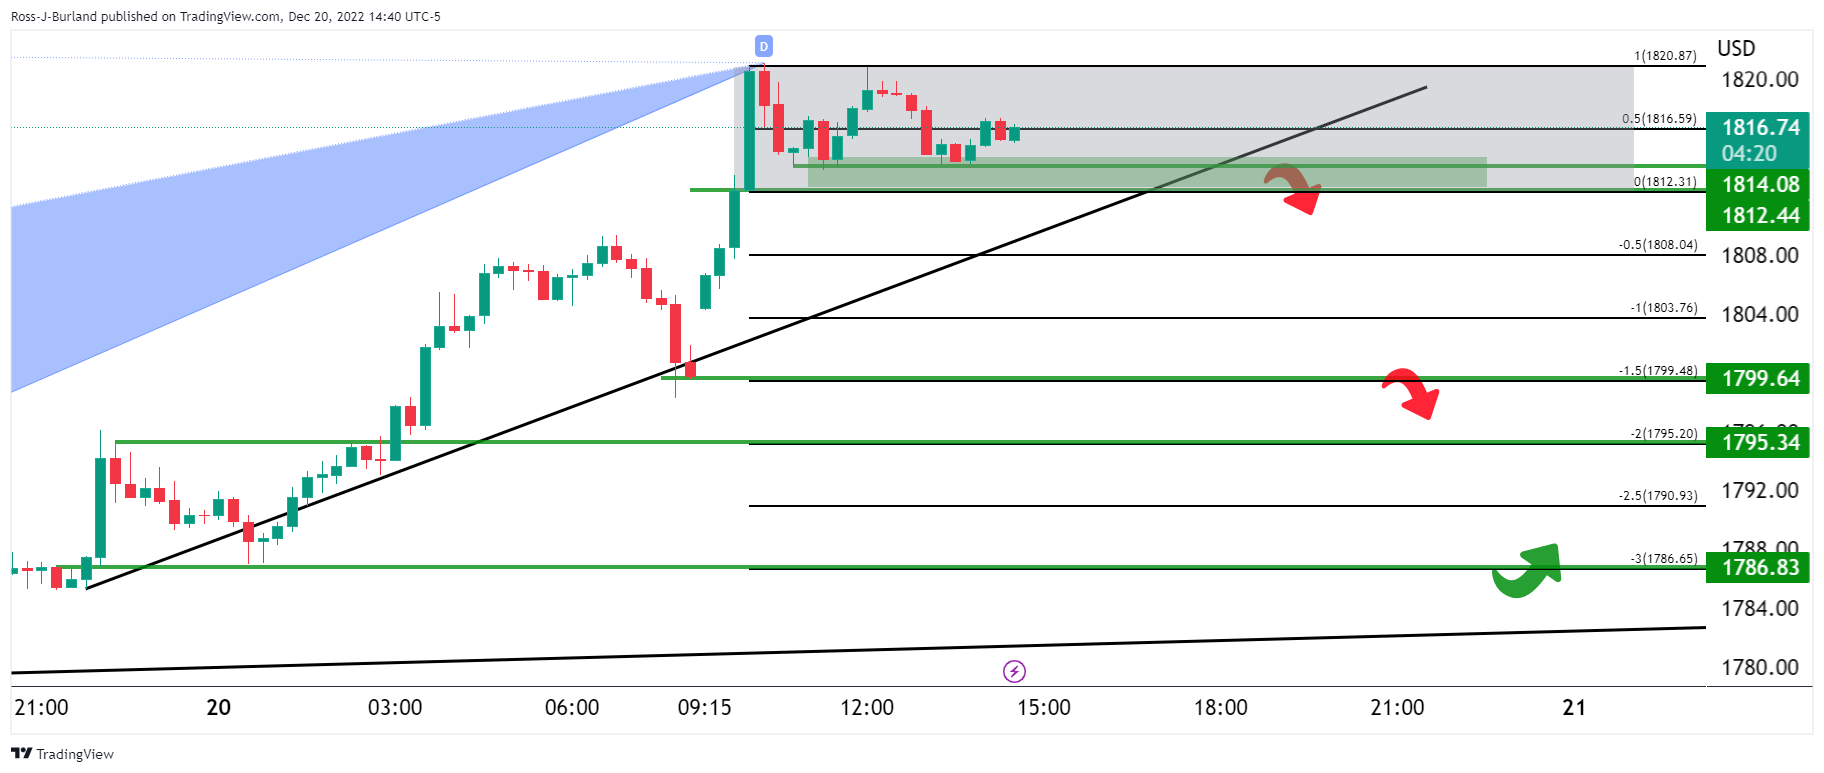
On the 15-minute chart for the Gold price, we can draw the extensions to the downside based on the presumed sideways consolidation box that could form over the coming sessions/days due to the pull of the harmonic bearish pattern on the Gold price daily chart.
Author

Ross J Burland
FXStreet
Ross J Burland, born in England, UK, is a sportsman at heart. He played Rugby and Judo for his county, Kent and the South East of England Rugby team.


