- Gold price has attempted a recovery and has scaled to near $1,994.60 amid a mild correction in the USD Index.
- It would not be justified considering Gold’s recovery move as a reversal as bets for one more rate hike from the Fed is extremely solid.
- Fed’s Beige Book will provide cues about the current economic situation of 12 Fed districts.
Gold price (XAU/USD) has shown a recovery move after printing an eight-day low of $1,981.02 on late Monday. The precious metal has rebounded to near $1,996.00 after a mild correction in the US Dollar Index (DXY). It would not be justified considering the recovery move as a reversal as bets for one more rate hike from the Federal Reserve (Fed) are extremely solid.
S&P500 futures are choppy in early trade after a bullish Monday. US equities are ignoring China-Taiwan tensions, portraying a risk-on mood. Reports showed that Taiwan will purchase up to 400 land-launched harpoon missiles to repel a potential Chinese invasion, completing a deal approved by Congress in 2020.
The US Dollar Index (DXY) is juggling above 102.00 after a mild correction. The upside bias has not faded yet as Federal Reserve (Fed) policymakers are not convinced of easing inflationary pressures. and CEO of the Federal Reserve Bank of Richmond Thomas Barkin said in the late New York session that he wants to see more evidence of inflation settling back to target.
This week, the release of Fed’s Beige Book will be keenly observed. The report will provide cues about the current economic situation of 12 Fed districts. Also, it will provide a true picture of retail demand and employment levels on a regional basis.
Gold technical analysis
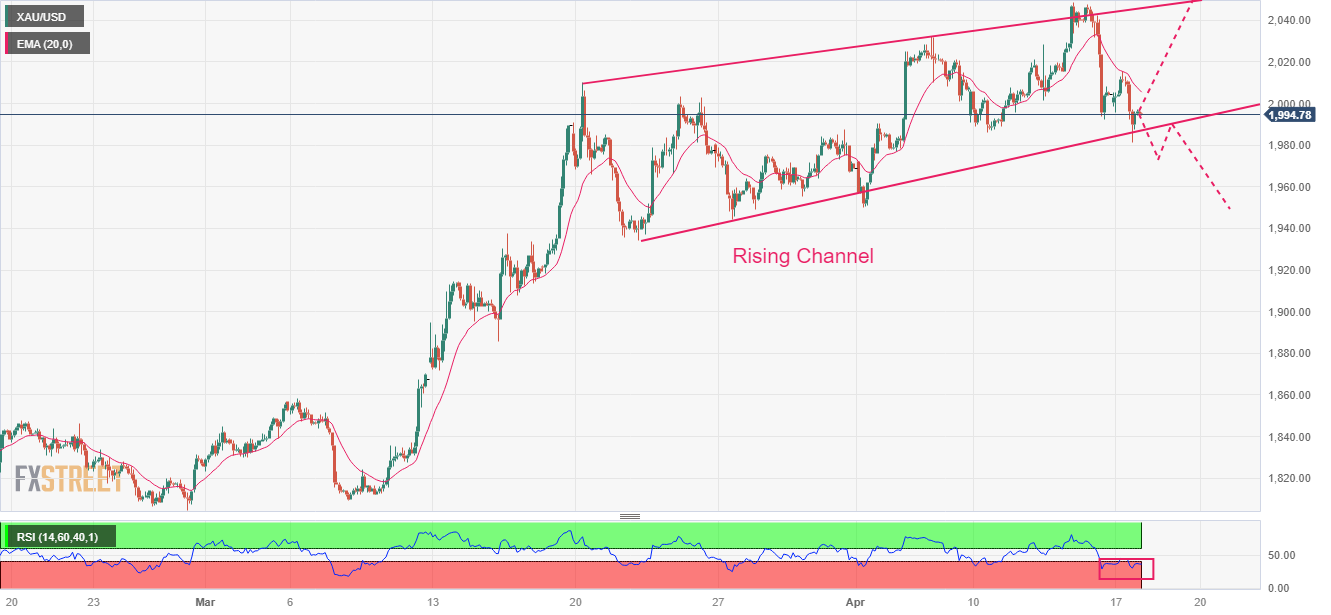
Gold price is hovering near the lower portion of the Rising Channel chart pattern formed on a two-hour scale. The precious metal dropped sharply after failing to test the critical resistance of $2,050.00 but has found an intermediate cushion near the Rising Channel edge. The 20-period Exponential Moving Average (EMA) at $2,005.60 is acting as a barricade for the Gold bulls.
The Relative Strength Index (RSI) (14) has shifted into the bearish range of 20.00-40.00, indicating activation of bearish momentum.
Gold two-hour chart
Information on these pages contains forward-looking statements that involve risks and uncertainties. Markets and instruments profiled on this page are for informational purposes only and should not in any way come across as a recommendation to buy or sell in these assets. You should do your own thorough research before making any investment decisions. FXStreet does not in any way guarantee that this information is free from mistakes, errors, or material misstatements. It also does not guarantee that this information is of a timely nature. Investing in Open Markets involves a great deal of risk, including the loss of all or a portion of your investment, as well as emotional distress. All risks, losses and costs associated with investing, including total loss of principal, are your responsibility. The views and opinions expressed in this article are those of the authors and do not necessarily reflect the official policy or position of FXStreet nor its advertisers. The author will not be held responsible for information that is found at the end of links posted on this page.
If not otherwise explicitly mentioned in the body of the article, at the time of writing, the author has no position in any stock mentioned in this article and no business relationship with any company mentioned. The author has not received compensation for writing this article, other than from FXStreet.
FXStreet and the author do not provide personalized recommendations. The author makes no representations as to the accuracy, completeness, or suitability of this information. FXStreet and the author will not be liable for any errors, omissions or any losses, injuries or damages arising from this information and its display or use. Errors and omissions excepted.
The author and FXStreet are not registered investment advisors and nothing in this article is intended to be investment advice.
Recommended content
Editors’ Picks
EUR/USD under pressure below 1.0400 on persistent USD strength
EUR/USD remains deep in the negative territory below 1.0400 on Tuesday, erasing a portion of Monday's gains. The pair is undermined by risk aversion and the persistent US Dollar demand, fuelled by US President Trump's tariff threats.
GBP/USD stays below 1.2300 after UK employment data
GBP/USD stays under bearish pressure and trades below 1.2300 on Tuesday as the USD preserves its strength following US President Trump's tariff threats. The data from the UK showed that the ILO Unemployment Rate edged higher to 4.4% in the three months to November.
Gold trades at multi-month highs above $2,720
Gold gathers bullish momentum and trades at its highest level since early November above $2,720 on Tuesday. The benchmark 10-year US Treasury bond yield is down more than 1% below 4.6% following US President Trump's tariff threats, helping XAU/USD hold its ground.
Bitcoin fails to sustain the $109K mark after Trump’s inauguration
Bitcoin’s price steadies above the $102,000 mark on Tuesday after reaching a new all-time high of $109,588 the previous day. Santiment’s data shows that BTC prices quickly corrected, as social media showed major greed and FOMO among the traders in Bitcoin after President Donald Trump’s inauguration.
Prepare for huge US trade changes as Trump goes America first
You can be sure that big changes are coming as far as US trade is concerned, even if we didn't get any new tariffs on President Trump's first day in office. A comprehensive investigation into US trade relationships was initiated via a memorandum. China, Canada, and Mexico are clearly in the immediate firing line.
Trusted Broker Reviews for Smarter Trading
VERIFIED Discover in-depth reviews of reliable brokers. Compare features like spreads, leverage, and platforms. Find the perfect fit for your trading style, from CFDs to Forex pairs like EUR/USD and Gold.