|

Gold Price Forecast: XAU/USD rebounds above $1,990 but needs to pass more filters to regain confidence

  • Gold price is retesting the breakdown of the Rising Channel pattern amid a delay in US debt-ceiling issues.
  • A slower pace in the expansion of US Retail Sales has strengthened expectations of a steady monetary policy stance by the Fed.
  • The postponement of approval for the debt-ceiling cap has improved demand for US government bonds.

Gold price (XAU/USD) has shown some buying interest after dropping below $1,990.00 in the Tokyo session. The precious metal has witnessed some recovery as the US Dollar Index (DXY) is struggling in extending its upside move further above 102.70. The Gold price has yet not developed a strong upside bias as it needs to pass through more filters for gaining traction.

S&P500 futures have added decent gains in Asia despite the postponement of approval for raising the US Treasury borrowing cap limit. One thing is for sure that the approval of default is off the table. Every delegate has admitted that the US debt-ceiling cannot be raised along with bulking spending initiatives as it could be a disaster.

The postponement of approval for the debt-ceiling cap has improved demand for US government bonds. This has led to a decline in 10-year US Treasury yields to 3.53%.

The USD Index is facing barricades in extending its recovery above 102.70 as a slower pace in the expansion of US Retail Sales has strengthened expectations of a steady monetary policy stance by the Federal Reserve (Fed). The economic data expanded at a slower pace of 0.4% against the estimate of 0.7%. A mild expansion is insufficient to impact expectations for a steady monetary policy by the Fed.

Gold technical analysis

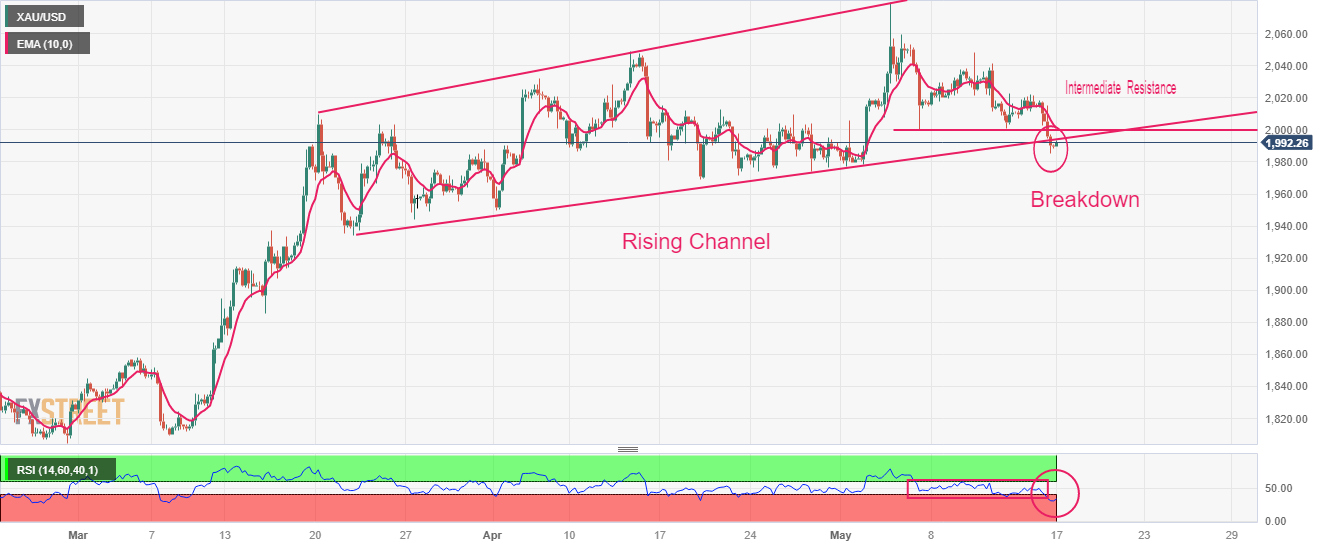
Gold price has delivered a breakdown of the Rising Channel chart pattern formed on a four-hour scale, however, the breakdown needs to pass some more filters yet. An intermediate resistance is plotted from May 05 low at $1,999.54. Downward-sloping 10-period Exponential Moving Average (EMA) at $2,000.00 is barricading the Gold bulls.

The Relative Strength Index (RSI) (14) has slipped into the bearish range of 20.00-40.00, which indicates more downside ahead.

Gold four-hour chart

XAU/USD

Overview
Today last price1992.58
Today Daily Change3.36
Today Daily Change %0.17
Today daily open1989.22
 
Trends
Daily SMA202007.91
Daily SMA501978.5
Daily SMA1001924.06
Daily SMA2001823.15
 
Levels
Previous Daily High2018.38
Previous Daily Low1985.53
Previous Weekly High2048.27
Previous Weekly Low2000.95
Previous Monthly High2048.75
Previous Monthly Low1949.83
Daily Fibonacci 38.2%1998.08
Daily Fibonacci 61.8%2005.83
Daily Pivot Point S11977.04
Daily Pivot Point S21964.86
Daily Pivot Point S31944.19
Daily Pivot Point R12009.89
Daily Pivot Point R22030.56
Daily Pivot Point R32042.74

Author

Sagar Dua

Sagar Dua

FXStreet

Sagar Dua is associated with the financial markets from his college days. Along with pursuing post-graduation in Commerce in 2014, he started his markets training with chart analysis.

More from Sagar Dua
Share:

Markets move fast. We move first.

Orange Juice Newsletter brings you expert driven insights - not headlines. Every day on your inbox.

By subscribing you agree to our Terms and conditions.

Editor's Picks

EUR/USD: Bulls pray for a dovish Fed

EUR/USD has finally taken a breather after a pretty energetic climb. The pair broke above 1.1680 in the second half of the week, reaching its highest levels in around two months before running into some selling pressure. Even so, it has gained almost two cents from the late-November dip just below 1.1500 the figure.

GBP/USD trims gains, recedes toward 1.3320

GBP/USD is struggling to keep its daily advance, coming under fresh pressure and retreating to the 1.3320 zone following a mild bullish attempt in the Greenback. Even though US consumer sentiment surprised to the upside, the US Dollar isn’t getting much love, as traders are far more interested in what the Fed will say next week.

Gold: Bullish momentum fades despite broad USD weakness

After rising more than 3.5% in the previous week, Gold has entered a consolidation phase and fluctuated at around $4,200. The Federal Reserve’s interest rate decision and revised Summary of Economic Projections, also known as the dot plot, could trigger the next directional move in XAU/USD. 

Week ahead: Rate cut or market shock? The Fed decides

Fed rate cut widely expected; dot plot and overall meeting rhetoric also matter. Risk appetite is supported by Fed rate cut expectations; cryptos show signs of life. RBA, BoC and SNB also meet; chances of surprises are relatively low. Dollar weakness could linger; both the aussie and the yen best positioned to gain further. Gold and oil eye Ukraine-Russia developments; a peace deal remains elusive.

Week ahead – Rate cut or market shock? The Fed decides

Fed rate cut widely expected; dot plot and overall meeting rhetoric also matter. Risk appetite is supported by Fed rate cut expectations; cryptos show signs of life. RBA, BoC and SNB also meet; chances of surprises are relatively low.

Ripple faces persistent bear risks, shrugging off ETF inflows

Ripple is extending its decline for the second consecutive day, trading at $2.06 at the time of writing on Friday. Sentiment surrounding the cross-border remittance token continues to lag despite steady inflows into XRP spot ETFs.