Gold Price Forecast: XAU/USD rebound needs validation from $1,788 and US inflation
- Gold price picks up bids to consolidate the biggest daily loss in a week.
- Rising wedge confirmation, hawkish Fed bets challenge XAU/USD buyers despite US Dollar’s retreat.
- US CPI for November bears downbeat forecasts but Core CPI signals firmer outcomes and can challenge Gold buyers.

Gold price (XAU/USD) retreats from intraday high as bulls battle with the critical support-turned-resistance below $1,800 during early Tuesday morning in Europe.
In doing so, the yellow metal cheers the broad pullback in the US Dollar ahead of the key US Consumer Price Index (CPI) for November. Also fueling the quote could be the market’s cautious optimism surrounding China and softer US Treasury yields.
That said, the US Dollar Index (DXY) remains sluggish, around 105.00, after rising in the last two consecutive days. The greenback’s latest inaction could be linked to the mixed signals surrounding the upcoming US inflation data and mixed geopolitical headlines.
The short-term inflation precursor from the New York Fed contrasts with the upbeat inflation expectations for the 5-year and 10-year reported by the St. Louis Federal Reserve (FRED) data. That said, the latest prints of the 5-year and 10-year inflation expectations portray a rebound to 2.28% and 2.35%, respectively.
On the same line, the last week’s downbeat prints of the United States Producer Price Index (PPI) also hinted at softer US inflation. Still, the University of Michigan’s (UoM) Consumer Sentiment Index, the US ISM Services PMI and inflation expectations from the UoM Survey suggested firmer prints of the US CPI.
Elsewhere, optimism surrounding China’s gradual removal of the Zero-Covid policy also helps the XAU/USD buyers. That said, the government of Shanghai city announced on Monday that they would deem all districts as "not at risk of Covid" from Tuesday, December 13, as reported by Reuters. Earlier Monday, Chinese officials announced they would take the application to track coronavirus cases offline later this week.
Alternatively, on Monday, Chinese Foreign Ministry spokesman Wang Wenbin conveyed dislike for the US sanctions on two of their diplomats. “These illegal sanctions severely affected Sino-American relations,” Wang said, per Reuters. Elsewhere, Russian President Vladimir Putin’s rejection to supply oil to countries respecting the Europe-led price cap also raised the market’s fears and exerted downside pressure on the XAU/USD price.
While portraying the mood, the US 10-year and two-year Treasury bond yields print the first daily loss in four, around 3.59% and 4.36% in that order, while the S&P 500 Futures print mild losses near 4,020 despite strong Wall Street close on Monday. It should be noted that the oil price improved, and the US Dollar Index (DXY) eased, but the traders remain cautious overall.
Looking forward, Gold traders will pay attention to the US inflation data as the market forecasts for the headline CPI for November signals a softer print of 7.3% YoY versus 7.7% prior figure, while the monthly CPI may ease to 0.3% compared to 0.4% previous readings. It should be noted that the CPI ex Food & Energy appears to be the key and is expected to be unchanged at 0.3% MoM, which can please the DXY buyers and weigh on XAU/USD prices in case of a firmer print.
Gold price technical analysis
Gold price struggles to recall the buyers after confirming the one-month-old rising wedge bearish chart pattern. In doing so, the yellow metal bounces off the weekly low after declining the most since December 05, the previous day.
However, a convergence of the 10-Day Moving Average (DMA) and the previous support line of the aforementioned wedge, around $1,788, challenges the XAU/USD bulls of late.
Even if the bullion manages to cross the $1,788 hurdle, the $1,800 threshold and a horizontal line comprising tops marked in August and early December, near $1,810, may restrict the precious metal’s further upside.
Alternatively, the late November swing high near $1,763 and October’s high near $1,730 could lure short-term Gold sellers during the theoretically anticipated fall toward the $1,690 level.
It should be noted that the bearish MACD signals and steady RSI (14) also keep Gold sellers hopeful.
Gold price: Daily chart
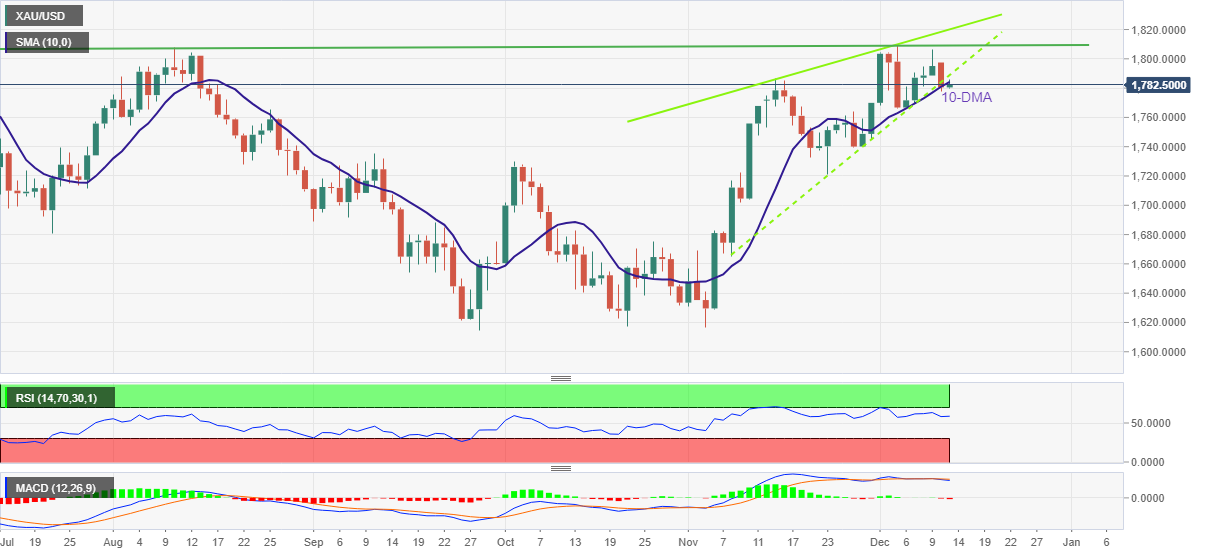
Trend: Further downside expected
Author

Anil Panchal
FXStreet
Anil Panchal has nearly 15 years of experience in tracking financial markets. With a keen interest in macroeconomics, Anil aptly tracks global news/updates and stays well-informed about the global financial moves and their implications.