Gold Price Forecast: XAU/USD pullback eyes $1,952 retest and US data – Confluence Detector
- Gold Price prints first daily loss in three, reverses from short-term upside hurdle within immediate trading range.
- Firmer US Dollar, yields weigh on XAU/USD amid downbeat China PMI, fears of Sino-American tension.
- Gold bears eyed US ISM Manufacturing PMI, JOLTS Job Openings for clues about Friday’s NFP.

Gold Price (XAU/USD) remains on the back foot around intraday low as it snaps a two-day winning streak while justifying the strong US Dollar and looming fears about China.
That said, the US Dollar Index (DXY) renews a three-week high as Treasury bond yields rebound despite mixed US activity data published the previous day. The reason for the latest run-up in the DXY and yields could be linked to the hawkish comments from Federal Reserve Bank of Chicago President Austan Goolsbee. Also underpinning the US Dollar strength could be the fears of more US-China tussle amid Beijing’s latest announcement of limiting the drone exports in retaliation to the US tech and trade war tactics, by citing the “national security” measures.
It’s worth noting that China’s Caixin Manufacturing PMI for July fails to trace its upbeat NBS counterpart while declining to 49.2 for July from 50.5 prior, versus 50.3 market forecasts, marking the lowest level since January, which in turn weighs on Gold Price as China is one of the biggest XAU/USD customers.
Alternatively, China's state planner National Development and Reform Commission (NDRC) issued a notice to promote the high-quality development of private investment earlier in the day and puts a floor under the XAU/USD price. That said, Chinese authorities also announced measures to boost consumption on Monday and bolstered the market sentiment.
Above all, the market’s preparations for the US ISM Manufacturing PMI for July and JOLTS Job Opening for June seem to weigh on the Gold Price.
Also read: Gold Price Forecast: XAU/USD rebound fades below $1,985 resistance as United States PMI loom
Gold Price: Key levels to watch
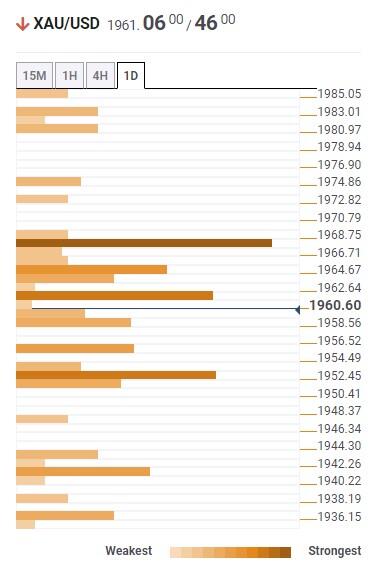
As per our Technical Confluence indicator, the Gold Price retreats from the top of the $1,950 and $1,970 trading range as market players brace for the first-line data/events scheduled for release this week.
On the downside, the lower band of the Bollinger joins Pivot Point one-day S1 and Fibonacci 23.6% on one week, around $1,952, puts a floor under the Gold Price.
Following that, a convergence of the Pivot Point one-week S1 and one-day S2, as well as the 200-SMA on four-hour (4H), can act as the final defense of the Gold buyers near $1,940 before directing them to the $1,900 round figure.
Alternatively, the 5-DMA and middle band of the Bollinger on the 4H timeframe restrict the immediate upside of the XAU/USD price near $1,962.
However, major attention will be given to the $1,969-70 resistance zone comprising the Fibonacci 61.8% on one week, 100-DMA and Fibonacci 23.6% on one-day and one-month.
Should the Gold buyers manage to cross the $1,970 hurdle, a multi-day-old horizontal resistance zone surrounding $1,985 may prod the XAU/USD bulls before directing them to the $2,000 psychological magnet.
Here is how it looks on the tool
About Technical Confluences Detector
The TCD (Technical Confluences Detector) is a tool to locate and point out those price levels where there is a congestion of indicators, moving averages, Fibonacci levels, Pivot Points, etc. If you are a short-term trader, you will find entry points for counter-trend strategies and hunt a few points at a time. If you are a medium-to-long-term trader, this tool will allow you to know in advance the price levels where a medium-to-long-term trend may stop and rest, where to unwind positions, or where to increase your position size
Author

Anil Panchal
FXStreet
Anil Panchal has nearly 15 years of experience in tracking financial markets. With a keen interest in macroeconomics, Anil aptly tracks global news/updates and stays well-informed about the global financial moves and their implications.


