Gold Price Forecast: XAU/USD prints four-day winning streak below $1,900 on Fed, China catalysts


  • Gold price grinds higher for the fourth consecutive day amid sluggish session.
  • Market’s reassessment of hawkish Fed talks, China-inspired risk-on mood favor XAU/USD bulls.
  • A light calendar could challenge the Gold price inside a short-term trading range.

Gold price (XAU/USD) remains firmer around $1,880 during the four-day uptrend on early Thursday.

In doing so, the metal buyers take clues from the US Dollar’s pullback, as well as risk-positive headlines surrounding China, amid sluggish trading hours of the day. That said, hawkish concerns surrounding the Federal Reserve (Fed), however, challenge the buyers but technical analysis joins the price-positive catalysts to portray XAU/USD upside.

US Dollar Index (DXY) traces softer Treasury bond yields to reverse the previous day’s recovery moves, down 0.22% intraday near 103.25 at the latest. That said, the US 10-year Treasury bond yields reversed from a one-month high to snap a three-day uptrend on Wednesday, pressured around 3.62% by the press time.

The pullback in yields could be linked to the market’s reassessment of the hawkish Fed talks as Chairman Jerome Powell hesitated in praising the jobs report but Fed Governor Christopher Waller, New York Federal Reserve President John Williams and Fed Governor Lisa Cook highlight inflation fear to suggest further rate increases from the US central bank. Furthermore, comments from the US diplomats such as Treasury Secretary Janet Yellen and President Joe Biden also amplified inflation concerns, as well as hopes of no recession in the US, which in turn suggests a safe side for the Fed to hike the benchmark rates.

On the other hand, risk appetite improves amid the sentiment-positive headlines surrounding China and the US. That said, the receding fears of the US-China jitters, following the China balloon shooting by the US, join hopes of People’s Bank of China’s (PBOC) rate cuts and the restart of the China-based companies’ listing on the US exchanges to favor risk-on mood. Additionally favoring the sentiment could be the receding recession woes surrounding China and the US. On Wednesday, global rating giant Fitch inflated China's growth forecasts while US Treasury Secretary Yellen and President Biden recently cheered hopes of growth in the current year.

While portraying the mood, the Asia-Pacific shares grind higher whereas the S&P 500 Futures ignore Wall Street’s losses to print mild gains by the press time.

Looking ahead, Gold price may have to rely on the risk catalysts amid a light calendar, comprising only the US Weekly Jobless Claims.

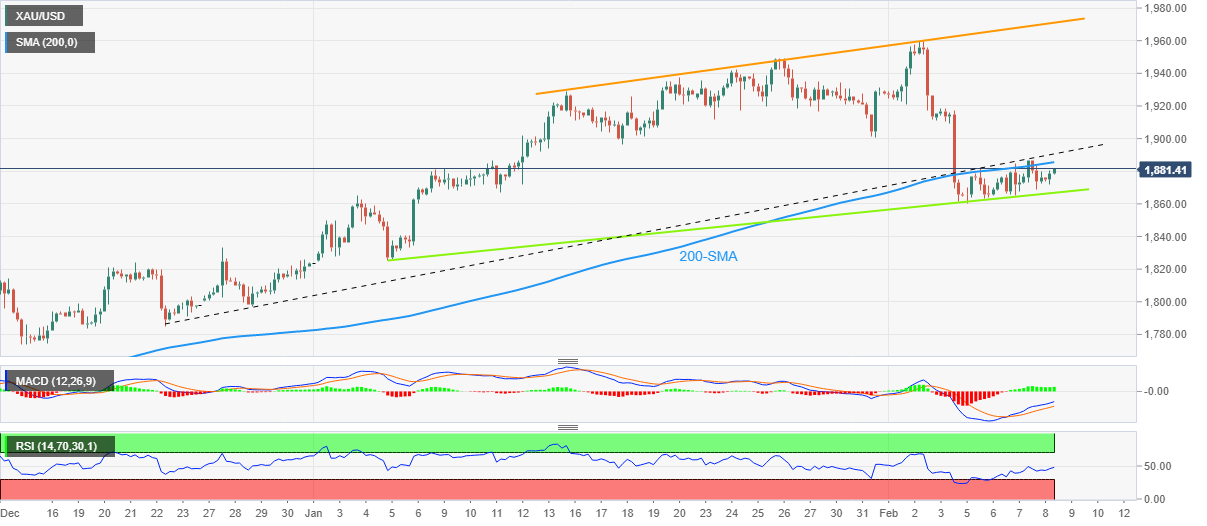
Gold price technical analysis

Gold price holds onto the week-start recovery from a five-week-old ascending support line, around $1,865 by the press time. Adding strength to the upside bias are the bullish MACD signals and firmer RSI (14).

However, the 200-SMA and previous support line from December 22, 2022, near $1,885 and $1,890 in that order, cap the metal’s immediate upside.

Hence, the yellow metal is likely to remain firmer between $1,865 and $1,890, despite maintaining the short-term trading range.

In a case where the XAU/USD remains firmer past $1,890, the $1,900 threshold and a three-week-old resistance line, close to $1,977 at the latest, will gain the market’s attention.

Alternatively, a downside break of $1,865 can drag the commodity prices toward the previous monthly low of $1,825.

Gold price: Four-hour chart

Trend: Limited recovery expected

Additional important levels

Overview
Today last price 1879.16
Today Daily Change 3.84
Today Daily Change % 0.20%
Today daily open 1875.32
 
Trends
Daily SMA20 1913.77
Daily SMA50 1853.15
Daily SMA100 1772.46
Daily SMA200 1775.99
 
Levels
Previous Daily High 1886.48
Previous Daily Low 1867.45
Previous Weekly High 1959.8
Previous Weekly Low 1861.45
Previous Monthly High 1949.27
Previous Monthly Low 1823.76
Daily Fibonacci 38.2% 1879.21
Daily Fibonacci 61.8% 1874.72
Daily Pivot Point S1 1866.35
Daily Pivot Point S2 1857.39
Daily Pivot Point S3 1847.32
Daily Pivot Point R1 1885.38
Daily Pivot Point R2 1895.45
Daily Pivot Point R3 1904.41


Share: Feed news

Information on these pages contains forward-looking statements that involve risks and uncertainties. Markets and instruments profiled on this page are for informational purposes only and should not in any way come across as a recommendation to buy or sell in these assets. You should do your own thorough research before making any investment decisions. FXStreet does not in any way guarantee that this information is free from mistakes, errors, or material misstatements. It also does not guarantee that this information is of a timely nature. Investing in Open Markets involves a great deal of risk, including the loss of all or a portion of your investment, as well as emotional distress. All risks, losses and costs associated with investing, including total loss of principal, are your responsibility. The views and opinions expressed in this article are those of the authors and do not necessarily reflect the official policy or position of FXStreet nor its advertisers. The author will not be held responsible for information that is found at the end of links posted on this page.

If not otherwise explicitly mentioned in the body of the article, at the time of writing, the author has no position in any stock mentioned in this article and no business relationship with any company mentioned. The author has not received compensation for writing this article, other than from FXStreet.

FXStreet and the author do not provide personalized recommendations. The author makes no representations as to the accuracy, completeness, or suitability of this information. FXStreet and the author will not be liable for any errors, omissions or any losses, injuries or damages arising from this information and its display or use. Errors and omissions excepted.

The author and FXStreet are not registered investment advisors and nothing in this article is intended to be investment advice.

Recommended content


Recommended content

Editors’ Picks

EUR/USD trades with negative bias, holds above 1.0700 as traders await US PCE Price Index

EUR/USD trades with negative bias, holds above 1.0700 as traders await US PCE Price Index

EUR/USD edges lower during the Asian session on Friday and moves away from a two-week high, around the 1.0740 area touched the previous day. Spot prices trade around the 1.0725-1.0720 region and remain at the mercy of the US Dollar price dynamics ahead of the crucial US data.

EUR/USD News

USD/JPY jumps above 156.00 on BoJ's steady policy

USD/JPY jumps above 156.00 on BoJ's steady policy

USD/JPY has come under intense buying pressure, surging past 156.00 after the Bank of Japan kept the key rate unchanged but tweaked its policy statement. The BoJ maintained its fiscal year 2024 and 2025 core inflation forecasts, disappointing the Japanese Yen buyers. 

USD/JPY News

Gold price flatlines as traders look to US PCE Price Index for some meaningful impetus

Gold price flatlines as traders look to US PCE Price Index for some meaningful impetus

Gold price lacks any firm intraday direction and is influenced by a combination of diverging forces. The weaker US GDP print and a rise in US inflation benefit the metal amid subdued USD demand. Hawkish Fed expectations cap the upside as traders await the release of the US PCE Price Index.

Gold News

Sei Price Prediction: SEI is in the zone of interest after a 10% leap

Sei Price Prediction: SEI is in the zone of interest after a 10% leap

Sei price has been in recovery mode for almost ten days now, following a fall of almost 65% beginning in mid-March. While the SEI bulls continue to show strength, the uptrend could prove premature as massive bearish sentiment hovers above the altcoin’s price.

Read more

US economy: Slower growth with stronger inflation

US economy: Slower growth with stronger inflation

The US Dollar strengthened, and stocks fell after statistical data from the US. The focus was on the preliminary estimate of GDP for the first quarter. Annualised quarterly growth came in at just 1.6%, down from the 2.5% and 3.4% previously forecast.

Read more

Forex MAJORS

Cryptocurrencies

Signatures