Gold Price Forecast: XAU/USD bulls drive forward but could be running on empty fumes
- Gold retreats from two-week high, challenges three-day uptrend amid quiet session.
- Mixed concerns over inflation, Fed’s next move and geopolitics direct traders towards traditional safe-haven.
- US CPI becomes crucial amid a mismatch between inflation expectations and Fed rate-hike expectations.
- Gold Price Forecast: Bulls defying a critical Fibonacci resistance level

Update: Gold (XAU/USD) is taking advantage of an offer in the greenback as Asian shares advance on Wednesday on the coattails of a solid performance in stocks on Wall Street. US Treasury yields are holding near multi-year highs ahead of closely watched US inflation data this week. DXY, an index that measures the greenback vs a basket of currencies, is down some 0.13% at the time of writing while XAU/USD is adding 0.14% to yesterday's business.
However, there is some firm ground that the greenback is walking and the gold bugs could be challenged any more soon considering the Consumer Price Index should cement expectations the US Federal Reserve will raise interest rates next month. If there is a stronger than expected number, this could seal the deal for a larger 50 basis point rise.
As per the prior analysis, and this week's, Gold, Chart of the Week: Bulls take on the 38.2% Fibo, now eye the 61.8% golden ratio, the price has finally moved on the 61.8% ratio as follows:
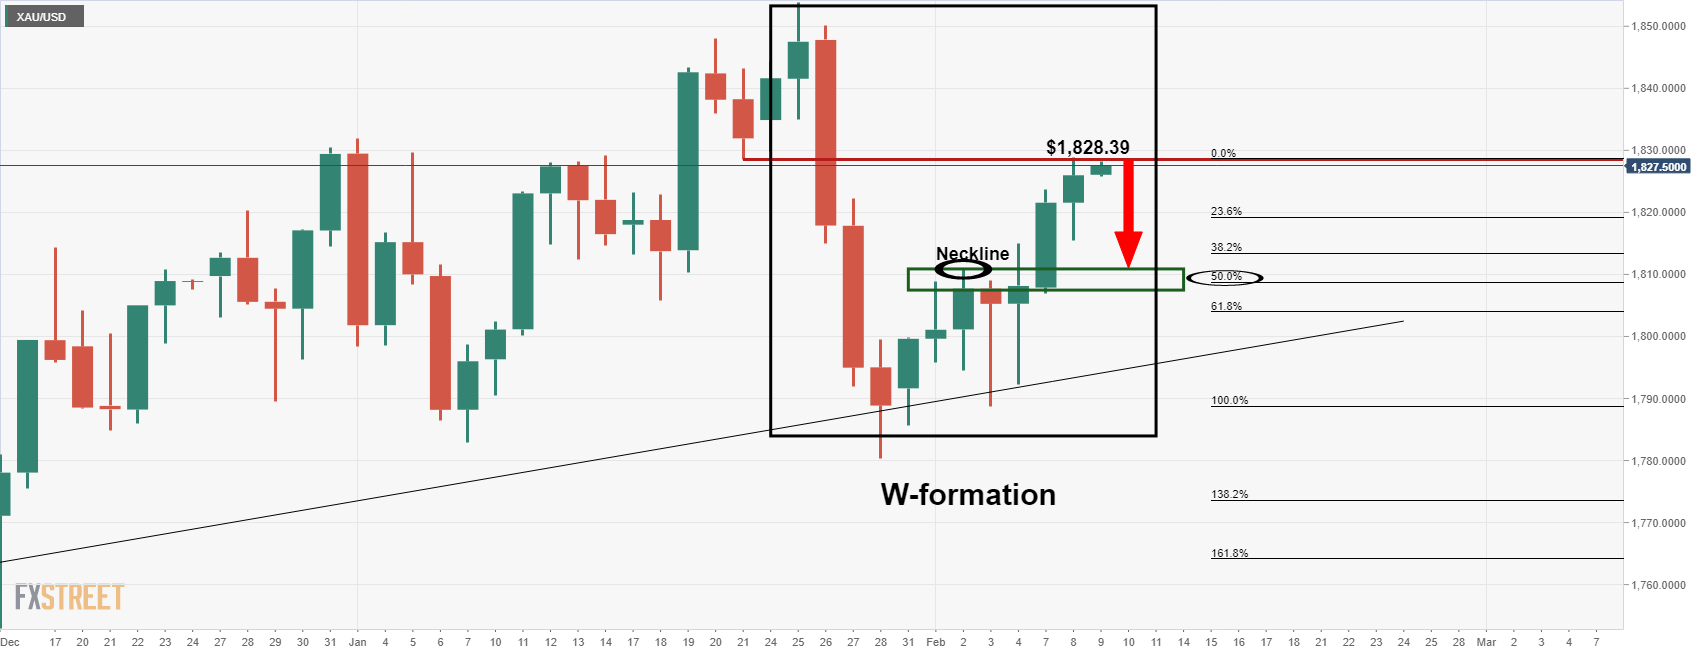
The bulls are up against an area of liquidity that could lead to supply entering the market which would typically cap the price. This leaves the focus on the downside which leaves the $1,811 vulnerable.
End of update
Gold (XAU/USD) buyers seem running out of steam after three consecutive days of the uptrend to the fortnight high, easing to $1,825 during Wednesday’s Asian session.
In doing so, the yellow metal portrays the market’s anxiety ahead of the key US Consumer Price Index (CPI) data amid multi-month high Treasury yields and sluggish US inflation expectations.
The benchmark US 10-year Treasury yields stay firmer around 1.956% following the previous day’s run-up to the highest levels since late 2019. On the contrary, US inflation expectations, as measured by the 10-year breakeven inflation rate per the St. Louis Federal Reserve (FRED) data, remain sluggish around a three-month low flashed during late January, recently around 2.42%.
That said, global traders remain anxious over the January inflation figures following the Fed’s upbeat performance. However, another player in the bull’s league, namely the European Central Bank (ECB), tried placating the reflation fears of late.
Also contributing to the gold’s upside momentum is the looming risk of a Russian invasion of Ukraine and the US-China trade tussles. On the same line are the latest comments from the Chinese Communist Party (CCP) that was quoted in the South China Morning Post (SCMP) as saying, “China should ‘support and guide’ the healthy development of capital, and prevent the ‘barbaric growth of capital.’”
It’s worth observing that the positive comments from Dr. Anthony Fauci, a leading US health expert, underpin the market’s optimism. However, reflation fears get the first hand charge and challenge covid-led optimism to favor gold prices. “The US is heading out of the “full-blown” pandemic phase of Covid-19, the US President’s Chief Medical Adviser said,” per the Financial Times (FT).
Amid these plays, Wall Street offered another positive day and the S&P 500 Futures also trade positive at the latest but the US Dollar Index (DXY) struggles to extend recovery moves.
Looking forward, risk catalysts and Fedspeak will direct short-term XAU/USD moves ahead of Thursday’s US inflation.
Technical analysis
Gold stays firmer inside the weekly bullish trend channel, recently easing from the top amid firmer RSI and MACD signals. Also favoring the upside bias is the metal’s successful trading beyond the 100 and 200 SMAs.
However, the previous support line from December 2021 precedes the stated channel’s upper line to challenge immediate advances of gold prices around $1,825-27.
Following that, a five-week-old horizontal area surrounding $1,829-32 will be a tough nut to crack for gold buyers, a break of which will open doors for a rally towards January’s peak surrounding $1,853.
Meanwhile, the 200-SMA and 100-SMA, respectively around $1,817 and $1,814, restrict short-term declines of the precious metal before directing gold sellers toward the channel’s support line, around $1,814 by the press time.
It’s worth noting, however, that gold’s downside past $1,814 will make it vulnerable to test the previous month’s low near $1,780 with the $1,800 threshold likely acting as an intermediate halt.
Gold: Four-hour chart
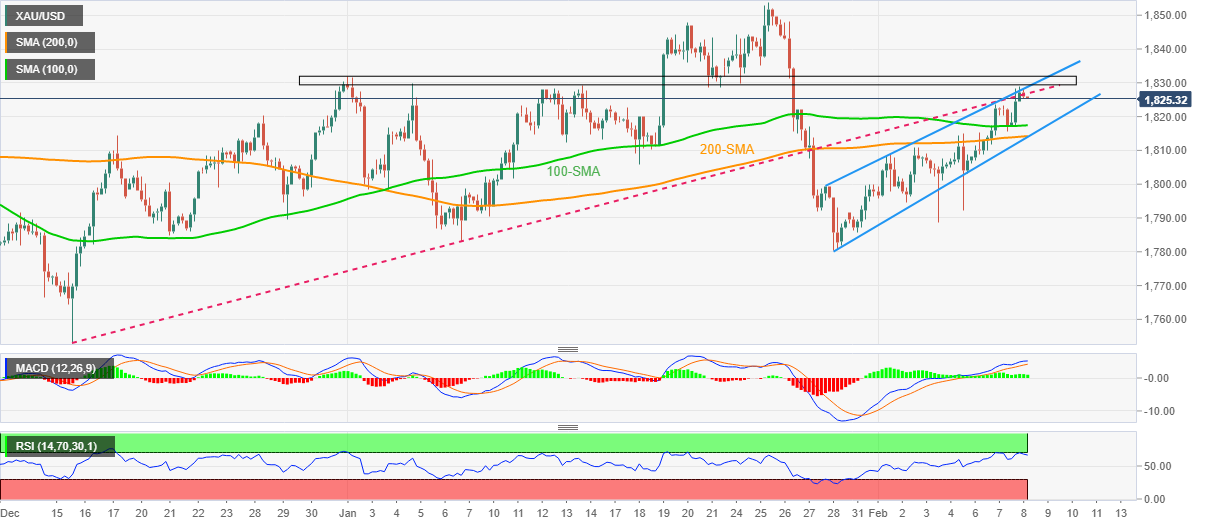
Trend: Further upside expected
Author

Anil Panchal
FXStreet
Anil Panchal has nearly 15 years of experience in tracking financial markets. With a keen interest in macroeconomics, Anil aptly tracks global news/updates and stays well-informed about the global financial moves and their implications.
















