Gold Price Forecast: XAU/USD looks to surpass $1,940 amid weaker yields, US GDP eyed


Share:
  • Gold price attempts to surpass $1,940.00 as US yields drop further.
  • The USD Index remains weak this year as attention is turning towards policy tightening in other advanced economies.
  • Gold price is auctioning in a Rising Wedge, portraying a volatility contraction.

Gold price (XAU/USD) aims to overstep the immediate resistance of $1,940.00 in the Tokyo session. The precious metal is gaining strength amid rising demand for the US government bonds that have weakened yields further. The 10-year US Treasury yields have dropped to near 3.45%.

A sell-off in the S&P500 futures indicates that the market participants' risk-taking capacity is fading away. Missed estimates by tech-giant Microsoft in its December earnings and technical glitch in NYSE are impacting United States equities. The US Dollar Index (DXY) displays a sideways profile around 101.50 as investors await US Gross Domestic Product (GDP) data for fresh impetus.

Gold price might find strength if US GDP contracts dramatically, which might further bolster the expectations for a smaller interest rate hike by the Federal Reserve (Fed) in its February meeting. As per the estimates, the annual Q4CY2022 GDP will contract to 2.8% from the former release of 3.2%. For the USD Index outlook, economists at CIBC Capital Markets look for the mighty US Dollar to weaken in 2023 as the Fed is set to undershoot market expectations for the peak fed funds rate, and attention is turning to policy tightening in other advanced economies.

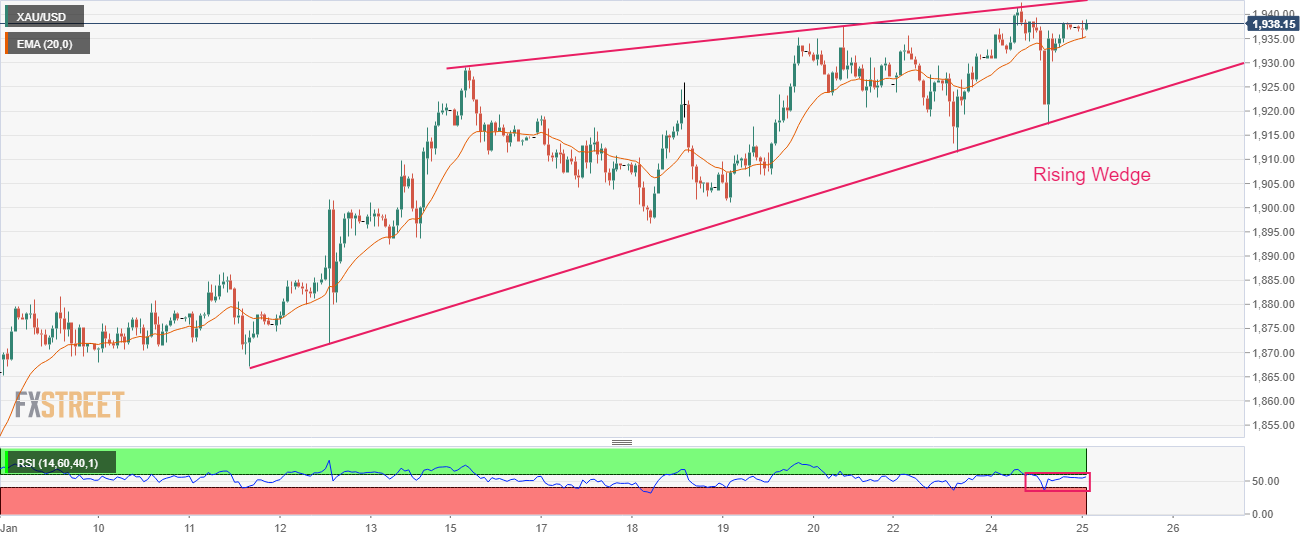
Gold technical analysis

Gold price is auctioning in a Rising Wedge chart pattern on an hourly scale that indicates volatility contraction, which will result in wider ticks and heavy volume after an explosion. The 20-period Exponential Moving Average (EMA) at $1,935.33 is a cushion for the Gold bulls.

Meanwhile, the Relative Strength Index (RSI) (14) oscillates in a 40.00-60.00 range, demonstrating a lackluster performance by the Gold price ahead.

Gold hourly chart

XAU/USD

Overview
Today last price 1938.11
Today Daily Change 0.16
Today Daily Change % 0.01
Today daily open 1937.95
 
Trends
Daily SMA20 1878.11
Daily SMA50 1818.87
Daily SMA100 1748.69
Daily SMA200 1775.67
 
Levels
Previous Daily High 1942.57
Previous Daily Low 1917.19
Previous Weekly High 1937.57
Previous Weekly Low 1896.63
Previous Monthly High 1833.38
Previous Monthly Low 1765.89
Daily Fibonacci 38.2% 1932.87
Daily Fibonacci 61.8% 1926.89
Daily Pivot Point S1 1922.57
Daily Pivot Point S2 1907.19
Daily Pivot Point S3 1897.19
Daily Pivot Point R1 1947.95
Daily Pivot Point R2 1957.95
Daily Pivot Point R3 1973.33


Share: Feed news

Information on these pages contains forward-looking statements that involve risks and uncertainties. Markets and instruments profiled on this page are for informational purposes only and should not in any way come across as a recommendation to buy or sell in these assets. You should do your own thorough research before making any investment decisions. FXStreet does not in any way guarantee that this information is free from mistakes, errors, or material misstatements. It also does not guarantee that this information is of a timely nature. Investing in Open Markets involves a great deal of risk, including the loss of all or a portion of your investment, as well as emotional distress. All risks, losses and costs associated with investing, including total loss of principal, are your responsibility. The views and opinions expressed in this article are those of the authors and do not necessarily reflect the official policy or position of FXStreet nor its advertisers. The author will not be held responsible for information that is found at the end of links posted on this page.

If not otherwise explicitly mentioned in the body of the article, at the time of writing, the author has no position in any stock mentioned in this article and no business relationship with any company mentioned. The author has not received compensation for writing this article, other than from FXStreet.

FXStreet and the author do not provide personalized recommendations. The author makes no representations as to the accuracy, completeness, or suitability of this information. FXStreet and the author will not be liable for any errors, omissions or any losses, injuries or damages arising from this information and its display or use. Errors and omissions excepted.

The author and FXStreet are not registered investment advisors and nothing in this article is intended to be investment advice.

Follow us on Telegram

Stay updated of all the news

Join Telegram

Recommended content


Follow us on Telegram

Stay updated of all the news

Join Telegram

Recommended content

Editors’ Picks

EUR/USD defends 1.0700 amid weaker US Dollar, EU data eyed

EUR/USD defends 1.0700 amid weaker US Dollar, EU data eyed

EUR/USD is trading modestly flat above 1.0700, finding support from a broad US Dollar weakness and the hawkish ECB expectations ahead of the mid-tier EU data this Tuesday. The market mood remains cautious, limiting the upside in the major. 

EUR/USD News

GBP/USD bears on the prowl at resistance

GBP/USD bears on the prowl at resistance

GBP/USD started the week off by dropping below 1.24, approaching a two-month low of 1.2306 reached on May 25th, as investors perceive a narrowing interest rate gap between the US and the UK. However, the Pound recovered those losses on the back of the weaker US dollar and data that put the Fed back into the spotlight on a dovish tip.

GBP/USD News

Gold gyrates within $1,955-73 trading zone

Gold gyrates within $1,955-73 trading zone

Gold price aptly portrays the sluggish markets heading into Tuesday’s European session, after an indecisive week. The XAU/USD highlights a lack of major data/events on the economic calendar, as well as mixed concerns about the Federal Reserve’s (Fed) moves and the diplomatic ties between the US and China.

Gold News

Is the metaverse hype back in action?

Is the metaverse hype back in action?

Although there are no major macroeconomic events this week, investors can expect massive volatility on a daily basis. The reasoning behind this outlook is that Apple will be conducting the 2023 Apple Worldwide Developers Conference (WWDC) on June 5.

Read more

Plotting the slope for the Fed's final glide path

Plotting the slope for the Fed's final glide path

Given that investors have very strong recession priors and it's well understood the services sectors are driving the bulk of the post-Covid cross-asset recovery, the negative services print was viewed a tad pessimistic on a multi-cross-asset level as the summer lull beckons.

Read more

Forex MAJORS

Cryptocurrencies

Signatures