Gold Price Forecast: XAU/USD hovers $1,900, eyes on data for Fed's hawkish signs – Confluence Detector
- Gold Price remains dicey as bears attack the key support while seeking confirmation of hawkish Fed bias.
- Fed’s preferred inflation, FOMC Minutes and NFP will be crucial to watch for clear XAU/USD directions.
- US-China headlines, central bankers’ speeches may entertain the Gold sellers.

Gold Price (XAU/USD) lacks clear directions even as bears keep the reins at the lowest levels in three months. That said, the metal’s latest inaction could be linked to the cautious mood ahead of the key US inflation clues, as well as amid mixed economics from China. Additionally, a lack of market participation amid the quarter-end positioning also seems to limit the XAU/USD moves of late.
The yellow metal dropped below the $1,900 threshold to refresh a 3.5-month low the previous day as US data bolstered the bets that the Fed will announce more rate hikes. On the same line were comments from Fed Chair Jerome Powell and Atlanta Federal Reserve President Raphael Bostic. It should be noted that the People’s Bank of China’s (PBoC) sustained defense of the Yuan, even at major costs, join the below 50.0 prints of the China PMI to also exert downside pressure on the Gold Price.
Elsewhere, firmer equities and Treasury bond yields allow traders to park their funds there and keep the XAU/USD bears hopeful.
Also read: Gold Price Forecast: XAU/USD rebound from under $1,900 offers hope for bulls
Gold Price: Key levels to watch
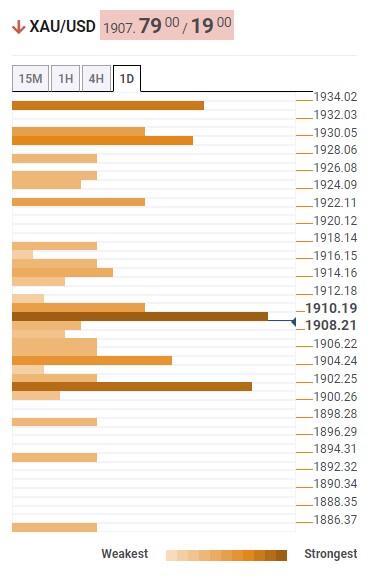
Our Technical Confluence Indicator signals that Gold price jostles with the key intraday resistance while grinding higher past short-term important support.
That said, the $1,910 level comprising Fibonacci 23.6% on one-day and the previous weekly low restricts immediate recovery of the Gold Price.
On the contrary, the lower band of the Bollinger on one-day, Fibonacci 61.8% on one-day and Pivot Point one-week S1 together restrict the XAU/USD downside near the $1,900 psychological magnet.
It’s worth observing that the Pivot Point one-month S1, around $1,905, offers immediate support to the Gold sellers.
In a case where the Gold Price rise past $1,910, a gradual run-up towards the Fibonacci 38.2% on one-week, near $1,930, and then to the previous monthly low of around $1,934 can’t be ruled out.
Meanwhile, a downside break of the $1,900 has almost clear road towards the south before hitting the Pivot Point one-day S2 near $1,886.
Here is how it looks on the tool
About Technical Confluences Detector
The TCD (Technical Confluences Detector) is a tool to locate and point out those price levels where there is a congestion of indicators, moving averages, Fibonacci levels, Pivot Points, etc. If you are a short-term trader, you will find entry points for counter-trend strategies and hunt a few points at a time. If you are a medium-to-long-term trader, this tool will allow you to know in advance the price levels where a medium-to-long-term trend may stop and rest, where to unwind positions, or where to increase your position size.
Author

Anil Panchal
FXStreet
Anil Panchal has nearly 15 years of experience in tracking financial markets. With a keen interest in macroeconomics, Anil aptly tracks global news/updates and stays well-informed about the global financial moves and their implications.

















