Gold Price Forecast: XAU/USD rebound from under $1,900 offers hope for bulls

XAU/USD Current price: $1,909.07
- Sharp rebound form under $1,900 takes some pressure off Gold.
- The bias is still to the downside but some consolidation signs are emerging.
- The Core Personal Consumption Expenditure Index will be critical for the Fed and also for Gold.
XAU/USD remains vulnerable despite erasing losses. A strong US Dollar pushed Gold to $1,892, the lowest level since March. Afterwards, it rebounded rising back to the $1,910 area, alleviating the bearish pressure. The fundamentals continue to complicated the outlook for the bulls.
Data from the US came in above expectations, with Initial Jobless Claims falling to the lowest level in four weeks at 239K, while Continuing Claims unexpectedly dropped to 1.742 million. Growth data for Q1 was revised higher from 1.3% to 2%. On the negative front, Pending Home Sales slid 2.7% in May, against expectations of a 0.2% increase.
The positive numbers from the labor market and GDP revision show that the US economy remains robust, keeping the doors open for more tightening from the Federal Reserve (Fed). US Treasury Yields spiked to weekly highs after the numbers and weighed on XAU/USD. The 10-year yield rose to 3.86%, the highest since March. At the same time, the US Dollar also gained momentum, with the DXY rising to two-week highs above 103.30.
Gold dropped below $1,900 for the first time since March and then staged a sharp rebound, even as US yields remained near daily highs, probably amid profit-taking. The bounce found resistance below $1,915, and the price stabilized around $1,910.
The rebound took some pressure off Gold, but the bias remains to the downside, and fundamentals continue to work against the yellow metal, with Powell speaking about higher interest rates and US data surpassing expectations. Certainly, the Core Personal Consumption Expenditure Index to be released on Friday will be critical for the Fed and also for Gold.
XAU/USD price short-term technical outlook
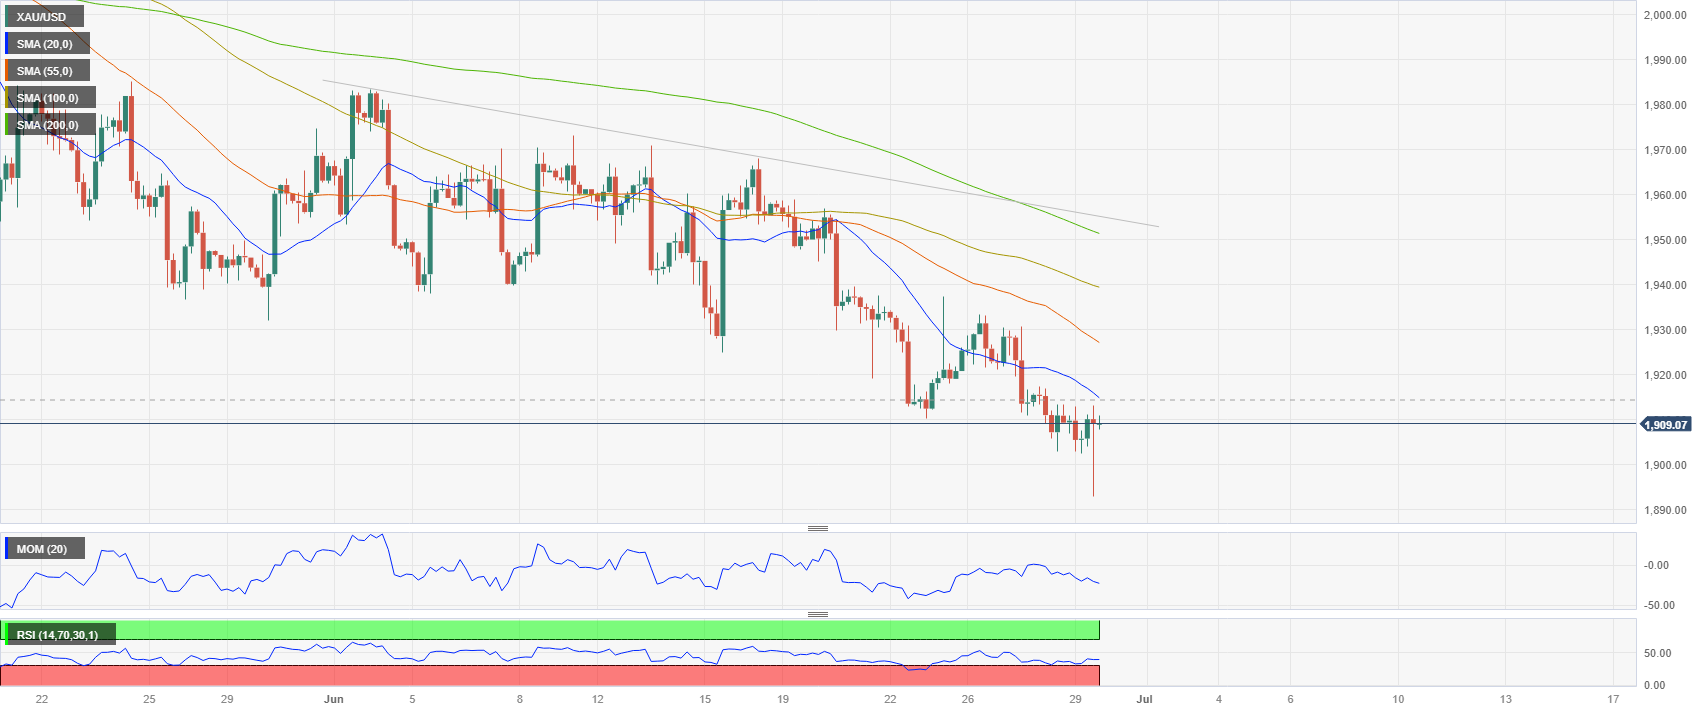
The daily chart for XAU/USD shows that bears continue to have control, but after a rebound of almost $20 back to the opening level, signs of potential consolidation are starting to emerge. These signals would become more relevant if the price holds above $1,900. The technical indicators on the chart continue to favor the downside, and the bias will prevail while the price stays under the dynamic support seen at $1,935 (downtrend line).
Technical readings on the 4-hour chart suggest more consolidation ahead, as long as the price remains in the $1,914/$1,902 range, with downside risks as the price stays below the 20-period Simple Moving Average (SMA). A recovery above $1,915 could add fuel to the rebound, paving the way to $1,920, with the next resistance level at $1,929. A drop below $1,900 would expose the June low at $1,892, with the next support level at $1,880.
Support levels: 1,902 1,892 1,885
Resistance levels: 1,914 1,929 1,941
Premium
You have reached your limit of 3 free articles for this month.
Start your subscription and get access to all our original articles.
Author

Matías Salord
FXStreet
Matías started in financial markets in 2008, after graduating in Economics. He was trained in chart analysis and then became an educator. He also studied Journalism. He started writing analyses for specialized websites before joining FXStreet.


