Gold Price Forecast: XAU/USD bulls giving way to the bears as Russian risk-premium disolves
- Gold prices remain sidelined after reversing from fresh high in eight months.
- Receding pessimism over Russia’s invasion of Ukraine triggered the metal’s pullback, despite mixed updates.
- US Retail Sales for January, Fed Minutes will be watched for fresh impulse, in addition to qualitative catalysts.
- Gold Price Forecast: Corrective decline may continue once below 1,841.40

Update: Gold is testing the commitments of the bulls at this juncture at an important support structure on the daily chart. In Asia, the price has been giving way to selling pressures with the early New York trade bid level around $1,850 acting as a magnetic pulling force. The eight-month peak was left behind on Tuesday with hints of a de-escalation in the Russia-Ukraine standoff as detailed below.
Meanwhile, the 61.8% golden ratio is a handful of dollars away that guards a run to test the $1,830's and $1,820 the figure thereafter:
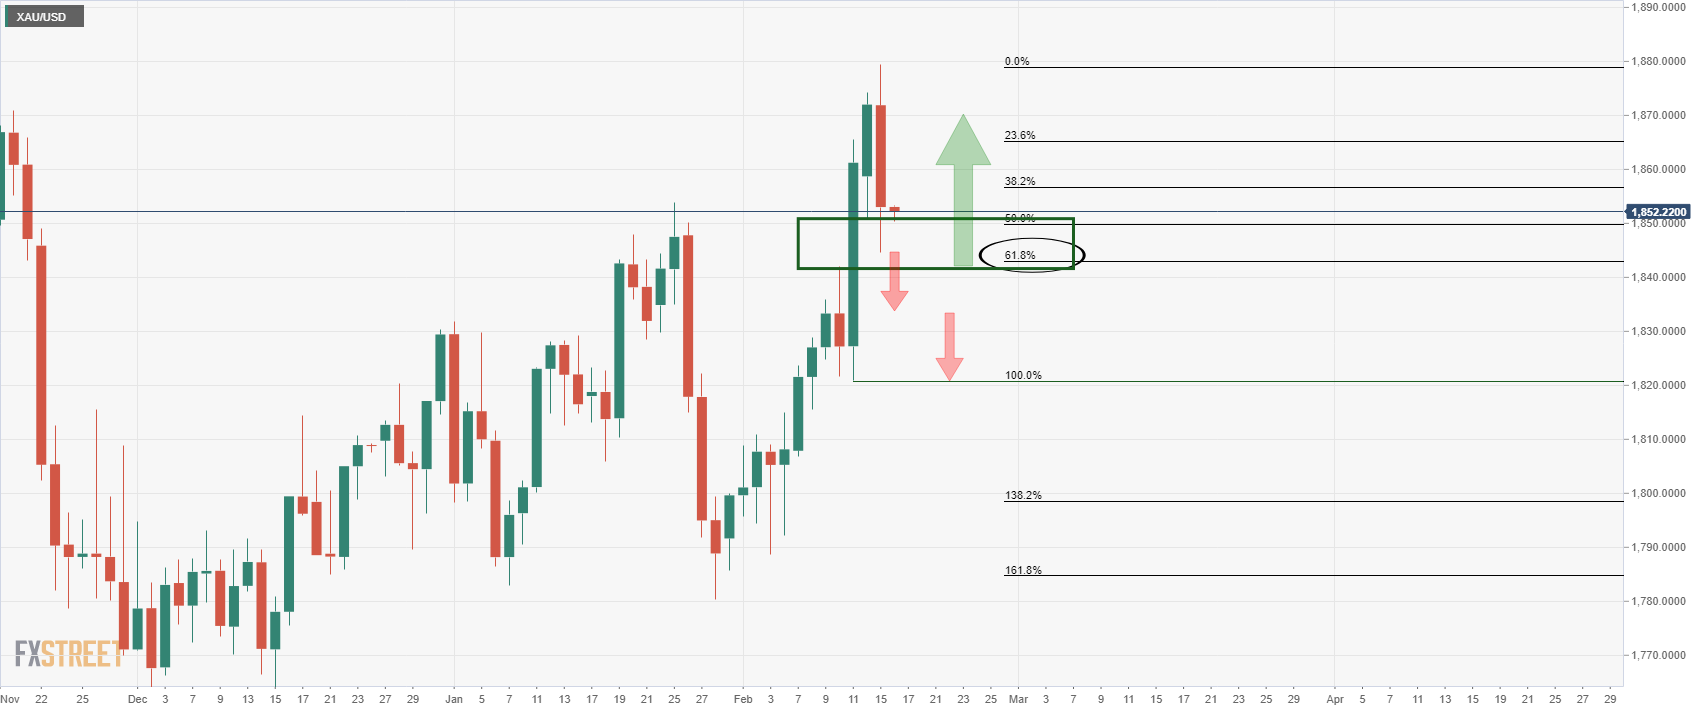
On the other hand, should the bulls commit to this support area, then there will be prospects of the $1,880 area once again for the days ahead.
End of update
Gold (XAU/USD) seeks fresh clues while taking rounds to $1,850 during Wednesday’s initial Asian session, following a notable pullback from an eight-month high.
The yellow metal marked an uptick to refresh the multi-day high before posting the biggest daily loss in three weeks by the end of Tuesday’s North American session. In doing so, the bullion traders respected the change in market sentiment, mainly due to headlines concerning the Russia-Ukraine war.
Headlines suggesting the retreat of some Russian troops from borders could be cited as the key catalyst for the market’s latest shift in mood, from a negative tone that previously underpinned the gold buying. Though comments from Russian President Vladimir Putin and his US counterpart Joe Biden keep the geopolitical risk on the table and challenge gold sellers, despite getting lesser attention. That said, Russia’s Putin conveyed dissatisfaction with how negations are going over Ukraine’s NATO membership while US President Biden said, “Russian attack on Ukraine still very much a possibility.”
It’s worth noting that a jump in the US Treasury yields also weighed on the gold prices as the benchmark 10-year T-bond coupons rose 4.7 basis points (bps) to 2.043%. It’s worth noting that the Wall Street benchmarks closed positive the previous day.
Escalating odds of Fed’s 0.50% rate hike in March, as well as firmer US inflation expectations portrayed by the 10-year breakeven inflation rate per the St. Louis Federal Reserve (FRED) data, also weighed on the gold prices.
Talking about the US data, the US Producer Price Index (PPI) data showed a hot factory-gate inflation figure supporting the Fed’s rate-hike concerns. That said, the PPI rose past 9.1% YoY expectations to 9.7%, versus upwardly revised 9.8% prior, in January whereas the Producer Price Index ex Food & Energy, also known as Core PPI, rallied to 8.3% versus 7.9% market consensus. Additionally, NY Empire State Manufacturing Index eased below 12.15 forecasts to 3.1, compared to -0.7 previous readouts.
Looking forward, China’s headline inflation data for January, namely Consumer Price Index (CPI) and Producer Price Index (PPI), should be watched for immediate direction. Forecasts suggest the CPI will ease to 1.0% YoY from 1.5% whereas the PPI may drop to 9.5% versus 10.3% previous reading. Should the data matches downbeat expectations, AUD/USD may have a reason to consolidate recent gains. However, major attention will be given to January Retail Sales from the US and Federal Open Market Committee (FOMC) Minutes amid chatters of a 0.50% rate lift in March.
Read: FOMC Minutes Preview: Dollar selling opportunity? Doves set for a comeback after hawkish meeting
Technical analysis
Gold’s U-turn from the highest levels last seen during June 2021 portrays a double-top bearish formation on the daily chart. The hopes of further downside also gain support from the RSI divergence as the higher high in prices mismatches the oscillator’s performance.
However, a clear downside break of the previous month’s peak near $1,853, also the $1,850 round figure becomes necessary for the gold seller’s conviction.
Following that, the 61.8% Fibonacci retracement (Fibo.) of June-August 2021 downside, around $1,828, holds the key to the bullion’s further weakness towards the 200-DMA and a two-month-old support line, respectively around $1,807 and $1,796.
Alternatively, the corrective pullback may initially be challenged by the $1,870 level ahead of highlighting the double tops around $1,878-80.
Should gold buyers manage to keep reins past $1,880, the $1,900 threshold and mid-January 2021 high around $1,917 will be in focus.
Gold: Daily chart
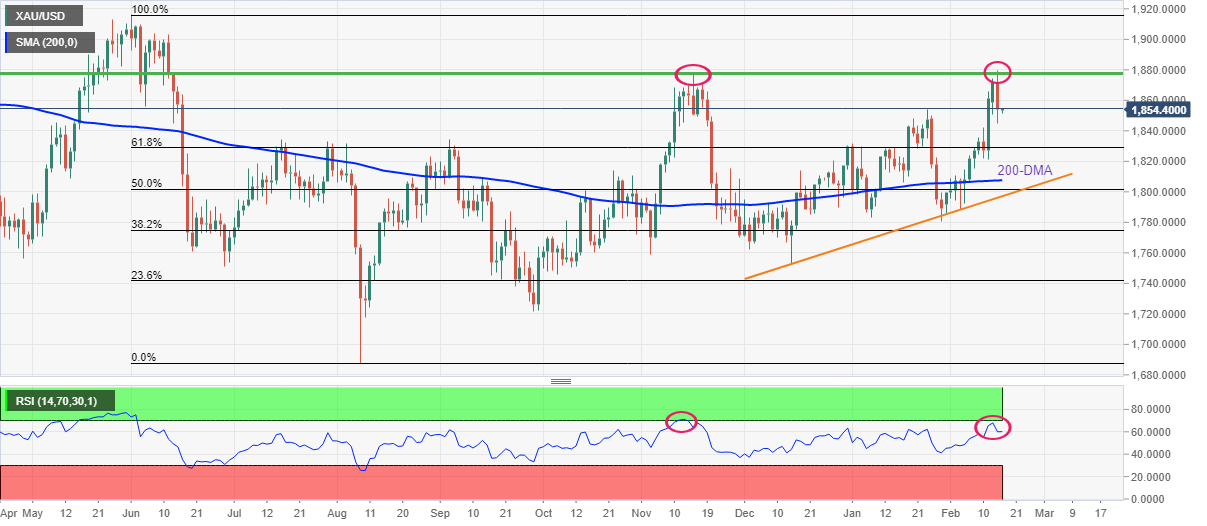
Trend: Further weakness expected
Author

Anil Panchal
FXStreet
Anil Panchal has nearly 15 years of experience in tracking financial markets. With a keen interest in macroeconomics, Anil aptly tracks global news/updates and stays well-informed about the global financial moves and their implications.


