Gold Price Forecast: XAU/USD faces heat around $1,830 as USD Index attempts recovery
- Gold price is facing heat while extending its recovery above $1,828.00 as USD Index has found a cushion.
- The extremely solid US labor market is strengthening the case of policy tightening continuation by the Fed.
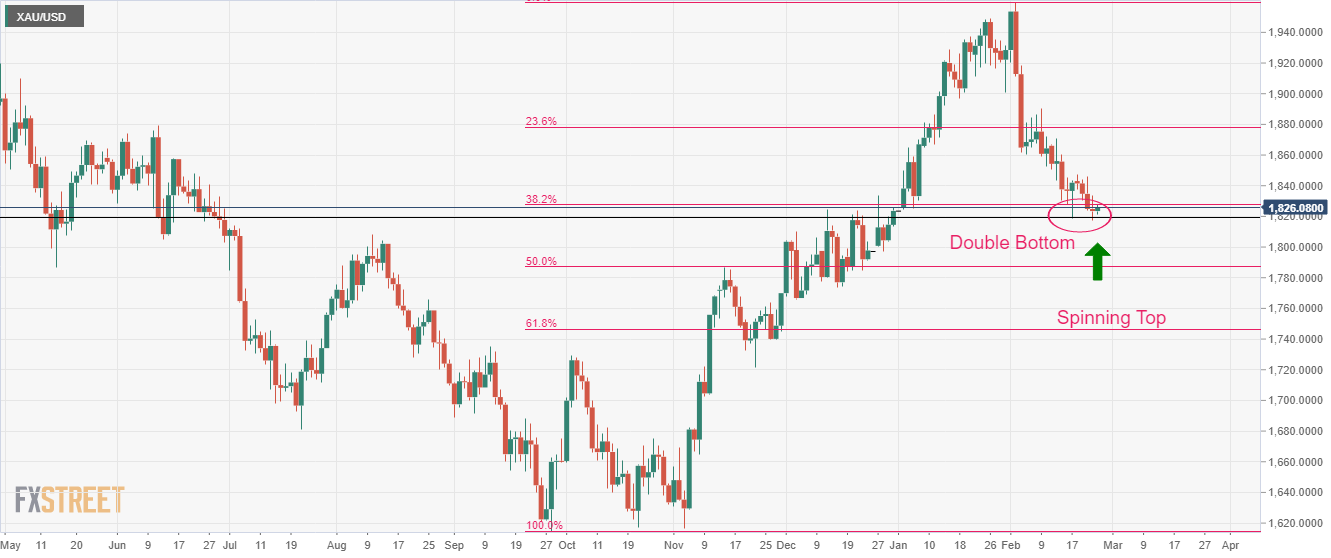
- A confluence of Double Bottom formation and Spinning Top near the 38.25 Fibo gives a green signal to a bullish reversal.

Gold price (XAU/USD) has sensed barricades while extending its recovery above $1,828.00 in the Asian session. The downside pressure in the precious metal looks confident as the US Dollar Index (DXY) has attempted a recovery after a correction to near 104.10. It looks like the risk-on impulse has retreated and the investors are shifting back to the risk-aversion theme.
S&P500 futures are displaying moderate losses after a positive Thursday. Global equities are prone to sheer volatility as worldwide sticky inflation could be addressed by more rates announcement. According to a Reuters poll of equity analysts, a slight majority of whom expected a correction within three months.
The yields on US government bonds are still struggling to recover after a severe correction. At the time of writing, the 10-year US Treasury Yields were available at around 3.87%.
For further guidance, investors will watch the United States Personal Consumption Expenditure (PCE) Price Index figures. On an annual basis, the economic data is seen higher at 4.3% vs. the former release of 4.4%. The monthly data is expected to escalate by 0.4% against 0.3% released earlier. Price pressures in the US economy have shown resilience after a declining trend led by a recovery in households’ spending and an upbeat labor market.
On Thursday, the US Department of Labor reported a surprise decline in the Initial Jobless Claims (IJC) to 193K from Bloomberg’s estimates of 200K. Meanwhile, Continuing claims that count individuals who have already received unemployment benefits for a week or more, decreased by 37,000 — the biggest drop since December — to 1.65 million in the week ended Feb. 11, as reported by Bloomberg.
No doubt, the labor market is extremely solid considering the declining jobless claims, multi-decade lowest Unemployment Rate, and solid job creation. This bolsters the fact that the Federal Reserve (Fed) cannot pause hiking rates further.
Gold technical analysis
Gold price has formed a Spinning Top candlestick pattern on the daily scale that conveys a reversal due to indecisiveness in the sentiment of market participants after a downside move. The importance of the Spinning Top candlestick formation is meaningful as it has formed near the 38.2% Fibonacci retracement (placed from November 3 low at $1,616.69 to February 2 high at $1.959.71) at $1,829.45.
The Gold price has also formed a Double Bottom chart pattern in which the second leg of the bottom has formed with less-confident, showing signs of a bullish reversal.
Gold daily chart
Author

Sagar Dua
FXStreet
Sagar Dua is associated with the financial markets from his college days. Along with pursuing post-graduation in Commerce in 2014, he started his markets training with chart analysis.


