- Gold price is aiming to surpass $2,020.00 as its appeal has improved amid US debt ceiling concerns.
- An extension in the US debt ceiling would result in a downgrade of the US long-term outlook.
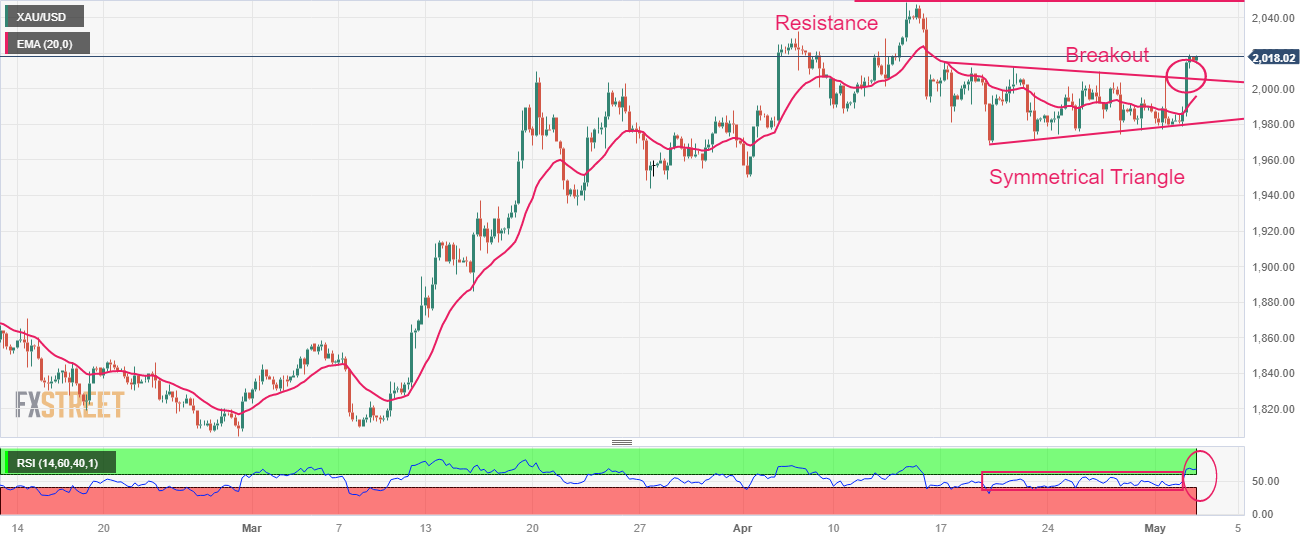
- Gold price is marching towards $2,048.75 after a symmetrical triangle breakout.
Gold price (XAU/USD) is gathering strength for a breakout above the immediate resistance of $2,020.00 in the Asian session. The precious metal has shifted into a bullish trajectory as concerns for the United States are mounting. After the headlines from US Treasury Secretary Janet Yellen that the Treasury will run out of funds in early June if the administration fails to raise the debt ceiling and will face problems in making payments.
US President Joe Biden is declining negotiations with US House of Senate Joseph McCarthy as Republicans want big cuts in President’s spending initiatives. However, concerns that the US economy won’t be able to make payments smoothly would force US Biden to come to the table for debt ceiling talks.
An extension in the US debt ceiling would result in a downgrade of the US long-term outlook, which would have a negative impact on the US Dollar, Treasury yields, and S&P500. However, the appeal of the Gold price will improve further as safe-haven.
Meanwhile, S&P500 futures have added moderate gains in Asia, showing signs of improvement in the risk appetite. However, the overall market mood is still risk-off. The US Dollar Index (DXY) has dropped sharply to near 101.72 and is expected to extend its downside to near 101.63 ahead of the Federal Reserve (Fed) policy.
A consecutive 25 basis points (bps) interest rate hike from Fed chair Jerome Powell is expected to be followed by neutral guidance as US labor market conditions are easing and manufacturing activities are consistently contracting.
Gold technical analysis
Gold price delivered a breakout of the Symmetrical Triangle chart pattern formed on a four-hour scale, which results in wider ticks and heavy volume. The yellow metal is marching towards the horizontal resistance plotted from April 13 high at $2,048.75.
Advancing 20-period Exponential Moving Average (EMA) at $1,996.47 will provide support to the Gold bulls.
The Relative Strength Index (RSI) (14) has climbed above 60.00 indicating that the upside momentum is active now.
Gold four-hour chart
Information on these pages contains forward-looking statements that involve risks and uncertainties. Markets and instruments profiled on this page are for informational purposes only and should not in any way come across as a recommendation to buy or sell in these assets. You should do your own thorough research before making any investment decisions. FXStreet does not in any way guarantee that this information is free from mistakes, errors, or material misstatements. It also does not guarantee that this information is of a timely nature. Investing in Open Markets involves a great deal of risk, including the loss of all or a portion of your investment, as well as emotional distress. All risks, losses and costs associated with investing, including total loss of principal, are your responsibility. The views and opinions expressed in this article are those of the authors and do not necessarily reflect the official policy or position of FXStreet nor its advertisers. The author will not be held responsible for information that is found at the end of links posted on this page.
If not otherwise explicitly mentioned in the body of the article, at the time of writing, the author has no position in any stock mentioned in this article and no business relationship with any company mentioned. The author has not received compensation for writing this article, other than from FXStreet.
FXStreet and the author do not provide personalized recommendations. The author makes no representations as to the accuracy, completeness, or suitability of this information. FXStreet and the author will not be liable for any errors, omissions or any losses, injuries or damages arising from this information and its display or use. Errors and omissions excepted.
The author and FXStreet are not registered investment advisors and nothing in this article is intended to be investment advice.
Recommended content
Editors’ Picks

AUD/USD: Further gains need to clear 0.6375
AUD/USD navigated an irresolute day on Wednesday, hovering around the 0.6350 zone on the back of further gains in the US Dollar and amid some prudence ahead of the release of the Australian jobs report on Thursday.

EUR/USD: Initial contention lies at 1.0400
EUR/USD kept its bearish trend well in place for the third consecutive day on Wednesday, slipping back to the 1.0400 zone in response to further improvement in the Greenback.

Gold retreats, holds firmly above $2,920
Prices of Gold now face increasing selling pressure and recedes to the area of daily lows near the $2,930 level per ounce troy in response to the strong bounce in the Greenback, and mixed US yields.

Dogecoin price targets $0.50 as Elon Musk enters $44 billion investment talks for X
Dogecoin price gained 0.30% on Wednesday, getting close to the $0.26 resistance after four consecutive days of losses. News reports show the DOGE markets were lifted by fresh investment talks involving Elon Musk’s social media company X.

Money market outlook 2025: Trends and dynamics in the Eurozone, US, and UK
We delve into the world of money market funds. Distinct dynamics are at play in the US, eurozone, and UK. In the US, repo rates are more attractive, and bills are expected to appreciate. It's also worth noting that the Fed might cut rates more than anticipated, similar to the UK. In the eurozone, unsecured rates remain elevated.

The Best brokers to trade EUR/USD
SPONSORED Discover the top brokers for trading EUR/USD in 2025. Our list features brokers with competitive spreads, fast execution, and powerful platforms. Whether you're a beginner or an expert, find the right partner to navigate the dynamic Forex market.