Gold Price Forecast: XAU/USD eyes a rally towards $1,878 amid Ukraine tensions – Confluence Detector
- Gold price gathers strength for the next upswing towards $1,878.
- US inflation concerns and the Russia-Ukraine turmoil to offer support.
- Gold corrects before resuming uptrend, focus on Russia-Ukraine crisis.

Gold price is taking a breather after a blistering $40 rally seen on Friday, which drove the bright metal to the highest level in three months at $1,866. Reports about a potential Russian invasion of Ukraine this week roiled markets and triggered a massive flight to safety into gold price. The bullion remains in a win-win situation going forward amid rising inflation concerns and as investors watch over the geopolitical risks concerning Ukraine. Gold traders also await Wednesday’s US Retail Sales data and the Fed minutes for fresh directives.
Gold Price: Key levels to watch
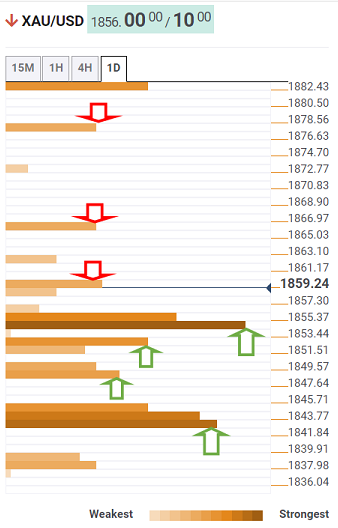
The Technical Confluences Detector shows that the gold price has recaptured powerful support now resistance at $1,855, as its corrective pullback fades.
That level is the convergence of the Fibonacci 23.6% one-day and the previous month’s high.
The immediate upside barrier is seen at the Bollinger Band one-day Upper at $1,859. The next bullish target appears at the previous day’s high of $1,866.
Acceptance above the latter will fuel a fresh upswing towards $1,878, the pivot point one-day R1.
On the flip side, if gold price finds a strong foothold below the aforementioned $1,855, then the Fibonacci 23.6% one-week at $1,851 will get tested.
Further down, the Fibonacci 38.2% one-day at $1,848 will come to buyers’ rescue. The last line of defense for gold bulls is aligned at $1,843, the intersection of the Fibonacci 38.2% one-week, SMA10 four-hour and pivot point one-month R1.
Here is how it looks on the tool
About Technical Confluences Detector
The TCD (Technical Confluences Detector) is a tool to locate and point out those price levels where there is a congestion of indicators, moving averages, Fibonacci levels, Pivot Points, etc. If you are a short-term trader, you will find entry points for counter-trend strategies and hunt a few points at a time. If you are a medium-to-long-term trader, this tool will allow you to know in advance the price levels where a medium-to-long-term trend may stop and rest, where to unwind positions, or where to increase your position size.
Author

Dhwani Mehta
FXStreet
Residing in Mumbai (India), Dhwani is a Senior Analyst and Manager of the Asian session at FXStreet. She has over 10 years of experience in analyzing and covering the global financial markets, with specialization in Forex and commodities markets.


