Gold Price Forecast: XAU/USD defies bullish bias on United States Treasury yield curve inversion, US data eyed
- Gold price holds lower ground after refreshing the monthly low on rejecting bullish technical formation.
- Inversion of the United States 10-year, 5-year yield curve hints at recession and weighs on XAU/USD price.
- Mixed comments from the Federal Reserve officials, downbeat US data probe Gold sellers.
- Early signals for the US inflation will be eyed for clear directions.

Gold price (XAU/USD) remains depressed at around $1,860 as markets await the key United States data during early Friday. It’s worth noting that the US Treasury bond yields renewed recession fears and weighed on the XAU/USD price the previous day. However, the mixed comments from the Federal Reserve (Fed) officials and optimism surrounding China appeared to have challenged the Gold buyers.
United States recession concerns weigh on Gold price
Even if United States President Joe Biden and Treasury Secretary Janet Yellen both turned down the fears of economic slowdown in the US, the Treasury bond yields were saying a different story the previous day and weighed on the Gold price. That said, the inversion of the yield curve between the 10-year and the two-year yields seemed to have triggered the latest economic fears by suggesting the market’s rush for risk safety amid recession woes.
The difference between the 10-year and 2-year Treasury bond yields turned the widest since 1980 as the former prints 3.66% and the latter came in around 4.50%. The same signaled the market’s recession fears and triggered the US Dollar run-up and weighed on the Gold price.
Federal Reserve bias turns bleak
Downbeat prints of the United States Weekly Initial Jobless Claims and comments from Richmond Federal Reserve (Fed) President Thomas Barkin seemed to have weighed on the US Dollar during the initial Thursday.
Fed’s Barkin appeared too dovish while suggesting rate cuts as he said that it would make sense for the Fed to steer "more deliberately" from here due to lagged effects of policy. Previously, Fed Chair Jerome Powell hesitated in cheering the upbeat US jobs report and raised fears of no more hawkish moves from the US central bank.
That said, the US Weekly Initial Jobless Claims rose to 196K versus 190K expected and 183K prior. “The advance number for seasonally adjusted insured unemployment during the week ending January 28 was 1,688,000, an increase of 38,000 from the previous week's revised level," said the US Department of Labor (DOL) showed on Thursday.
China story also puts a floor under the Gold price
Other than the Federal Reserve officials’ (Fed) ability to convince markets, risk-positive headlines surrounding China, one of the world’s biggest Gold consumers, also seemed to have challenged the XAU/USD bears ahead of the early signals of the United States inflation data.
US President Joe Biden’s taming of fears emanating from the US-China jitters, following the China balloon shooting by the US, joined the hopes of People’s Bank of China’s (PBOC) rate cuts and the restart of the China-based companies’ listing on the US exchanges to favor risk-on mood during early Thursday.
Early signals for US inflation eyed
Given the Gold bear’s control amid the mixed signals, XAU/USD traders should pay attention to the preliminary readings of the United States consumer-centric numbers for February like the Michigan Consumer Sentiment Index and 5-year Consumer Inflation Expectations. Above all, the market’s preparations for the next week’s US Consumer Price Index (CPI) will be important to watch.
That said, market forecasts hint at upbeat prints of the scheduled US data and hence challenge the XAU/USD buyers, together with the below-mentioned technical analysis.
Gold price technical analysis
Gold price extends pullback from the 200-bar Simple Moving Average (SMA) following its unsuccessful bounce off a seven-week-old bullish channel’s support line.
The XAU/USD downside also justifies the recent slump in the Relative Strength Index (RSI) line, placed at 14, as well as the looming bear cross on the Moving Average Convergence and Divergence (MACD) indicator.
It should be noted that the monthly horizontal resistance area surrounding $1,900-05 also appears a tough nut to crack for the Gold buyers, other than the 200-SMA level of near $1,888.
Following that, a run-up toward the monthly high of $1,960 can’t be ruled out. It’s worth noting that March 2022 high near $1,966 and the stated channel’s top line, close to $1,972 by the press time, could challenge the Gold buyers afterward.
Alternatively, a sustained downside break of the aforementioned ascending trend channel’s support line, near $1,870 at the latest, keeps directing the Gold bears towards the seven-week-old horizontal support area surrounding $1,825.
Overall, Gold is back on the bear’s radar ahead of the key US data, after a brief teasing to the bulls.
Gold price: Four-hour chart
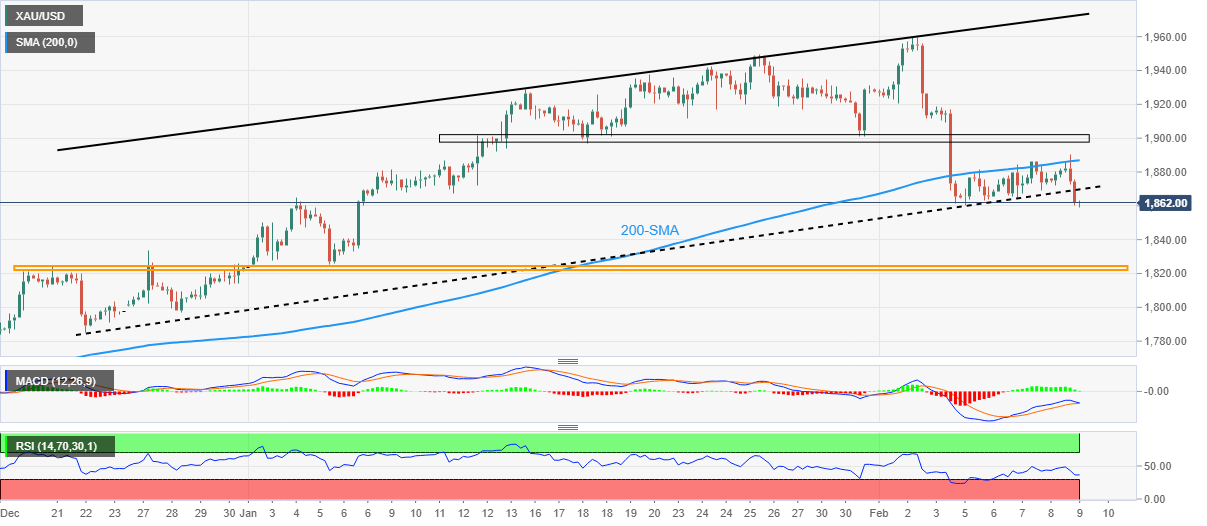
Trend: Further upside expected
Author

Anil Panchal
FXStreet
Anil Panchal has nearly 15 years of experience in tracking financial markets. With a keen interest in macroeconomics, Anil aptly tracks global news/updates and stays well-informed about the global financial moves and their implications.
















