- Gold price renews nine-month high while staying comfortably beyond $1,917 support confluence.
- US Dollar weakness, mixed sentiment allows XAU/USD bulls to keep the reins amid China’s off, Fed blackout.
- First readings of January’s PMI will direct intraday moves but US Q4 GDP will be more important to guidance.
Gold price (XAU/USD) refreshes a nine-month high as it picks up bids to $1,940 during the initial hour of Tuesday’s European session. In doing so, the bright metal cheers broad US Dollar weakness, as well as hopes of more demand from China, ahead of the monthly activity data. It’s worth noting that the cautious mood ahead of the key preliminary activity data from the US, Eurozone and the UK seemed to have put a floor under the Gold price of around $1,917.
Also read: Gold Price Forecast: XAU/USD eyes $1,942 and global PMIs for further upside
Gold Price: Key levels to watch
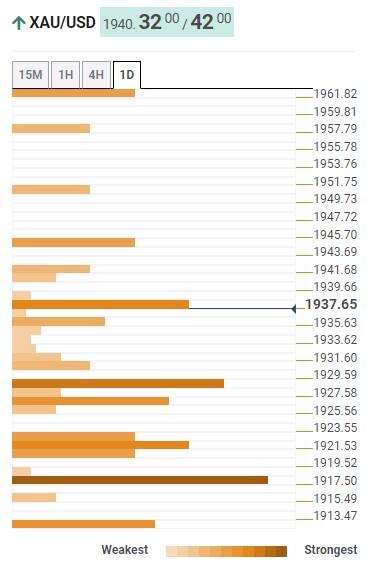
The Technical Confluence Detector shows that the Gold price grinds higher past the $1,917 support confluence including the Pivot Point one-day S1 and Pivot Point one-month R3.
That said, a convergence of the Fibonacci 23.6% on one-week, 50-HMA and the middle band of the Bollinger on the hourly play, around $1,930, appears immediate support for the Gold traders to watch.
It should be noted that a downside break of the $1,917 support confluence opens the door for Gold’s south-run towards the $1,900 threshold.
Alternatively, Pivot Point one-week R1 close to $1,945 appears the nearby hurdle for the XAU/USD bulls to aim for.
Following that, there prevails an empty road for the buyers to ride ahead of the April 2022 peak surrounding $1,966.
Here is how it looks on the tool
About Technical Confluences Detector
The TCD (Technical Confluences Detector) is a tool to locate and point out those price levels where there is a congestion of indicators, moving averages, Fibonacci levels, Pivot Points, etc. If you are a short-term trader, you will find entry points for counter-trend strategies and hunt a few points at a time. If you are a medium-to-long-term trader, this tool will allow you to know in advance the price levels where a medium-to-long-term trend may stop and rest, where to unwind positions, or where to increase your position size.
Information on these pages contains forward-looking statements that involve risks and uncertainties. Markets and instruments profiled on this page are for informational purposes only and should not in any way come across as a recommendation to buy or sell in these assets. You should do your own thorough research before making any investment decisions. FXStreet does not in any way guarantee that this information is free from mistakes, errors, or material misstatements. It also does not guarantee that this information is of a timely nature. Investing in Open Markets involves a great deal of risk, including the loss of all or a portion of your investment, as well as emotional distress. All risks, losses and costs associated with investing, including total loss of principal, are your responsibility. The views and opinions expressed in this article are those of the authors and do not necessarily reflect the official policy or position of FXStreet nor its advertisers. The author will not be held responsible for information that is found at the end of links posted on this page.
If not otherwise explicitly mentioned in the body of the article, at the time of writing, the author has no position in any stock mentioned in this article and no business relationship with any company mentioned. The author has not received compensation for writing this article, other than from FXStreet.
FXStreet and the author do not provide personalized recommendations. The author makes no representations as to the accuracy, completeness, or suitability of this information. FXStreet and the author will not be liable for any errors, omissions or any losses, injuries or damages arising from this information and its display or use. Errors and omissions excepted.
The author and FXStreet are not registered investment advisors and nothing in this article is intended to be investment advice.
Recommended content
Editors’ Picks
EUR/USD eases below 1.1000 ahead of German inflation data

EUR/USD is trading below 1.1000, losing its upside traction in the European session on Wednesday. The pair is holding steady, as the US Dollar finds its feet despite a sell-off in the US Treasury bond yields. Traders stay cautious ahead of the German inflation and US GDP data.
GBP/USD battles 1.2700 as US Dollar decline stalls

GBP/USD is battling 1.2700, extending its retreat from multi-month highs in European trading on Monday. The pair fails to find any inspiration from BoE Governor Bailey's hawkish comments, as the US Dollar looks to stabilize ahead of top-tier economic data and Fedspeak.
Gold price eases from multi-month peak, dovish Fed expectations favour bulls ahead of US GDP

Gold price (XAU/USD) advanced to a near seven-month peak, around the $2,052 area on Wednesday, albeit trims a part of its intraday gains heading into the European session.
Bitcoin price could touch $41,000 in December, analyst predicts bullish breakout

Bitcoin worth $1 billion has been withdrawn from exchanges in the last two weeks. The SEC asked for public feedback on Franklin Templeton’s Spot Bitcoin ETF, fueling anticipation of approval.
Germany CPI Preview: Inflation set to ease further, not necessarily negative for the Euro Premium

The Federal Statistical Office of Germany (Destatis) will release inflation data on Wednesday at 13:00 GMT. The annual German Consumer Price Index (CPI) is expected to rise 3.5% in November, down from the 3.8% increase reported in October.