Gold Price Forecast: XAU/USD bulls focus on Federal Reserve Chairman Powell, United States jobs report
- Gold price snaps four-week downtrend amid early March, eyes more upside.
- Mixed United States data, cautious optimism surrounding China strengthen XAU/USD upside moves.
- Equities closed positive, US Treasury bond yields retreat from multi-month high to favor Gold buyers.
- Federal Reserve Chairman Jerome Powell’s bi-annual Testimony, US jobs report appears the key for XAU/USD traders for fresh impulse.

Gold price (XAU/USD) began March on a front foot, by posting the first positive weekly close in five. The XAU/USD bulls keep the reins during the early hour of Monday’s Asian session, despite retreating from the highest levels in two weeks to around $1,857.
That said, the broad US Dollar weakness, amid a pullback in the United States Treasury bond yields, mixed United States data and the market’s cautious optimism, appears the key catalyst behind the Gold price run-up. The recent pause in the bull run could be linked to the market’s cautious mood ahead of the top-tier event, namely Federal Reserve (Fed) Chairman Jerome Powell’s half-yearly Testimony and the US employment report for February.
Gold price rallies on softer US Dollar
US Dollar Index (DXY) paused a four-week uptrend the last week by ending Friday’s North American session around 104.50. In doing so, the greenback’s gauge versus the six major currencies justified downbeat prints of the United States statistics, as well as a pullback in the US Treasury bond yields.
That said, US ISM Services PMI for February came in as 55.1 versus 54.5 market expectations and 55.2 market forecasts. The inflation component of the PMI survey, the Price Paid sub-index, edged lower to 65.6 in February from 67.8 but surpassed analysts' estimate of 64.5. The New Orders sub-index rose to 62.6 from 60.4 and the Employment Index advanced to 54 from 50 in the same period. Previously in that week, the US Durable Goods Orders for January eased while the Conference Board’s (CB) Consumer Confidence also flashed mostly downbeat details.
While the United States data eased, the Federal Reserve (Fed) talks remained hawkish and tried to defend the US Dollar bulls, as well as propel the US Treasury bond yields. Over the weekend, San Francisco Federal Reserve Bank President Mary Daly said that if data on inflation and the labor market continues to come in hotter than expected, interest rates will need to go higher, and stay there longer, than Fed policymakers projected in December, as reported by Reuters.
It should be noted, however, that the US Treasury bond yields initially refreshed the multi-month high before weighing on the US Dollar, as well as allowing the Gold buyers to retake control. The reason could be linked to the unimpressive US data and the market’s receding fears of recession, mainly favored by headlines from China. That said, the US 10-year Treasury bond yields rose to the highest levels since November 2022 before easing to 3.95% at the latest while the two-year counterpart poked the July 2007 levels.
China inspires XAU/USD bulls
Being one of the biggest Gold consumers, the recent improvements in China’s headline activity numbers for February, as well as the 5.0% growth target, appear to underpin the XAU/USD’s latest run-up. It’s worth noting that the chatters surrounding the resumption of the China-US trade negotiations also improved the market sentiment and pleased the Gold buyers.
“China set a modest target for economic growth this year of around 5% on Sunday as it kicked off the annual session of its National People's Congress (NPC), which is poised to implement the biggest government shake-up in a decade,” reported Reuters.
Alternatively, the US-China tension surrounding Taiwan and Russia seems to flag tensions for the Gold buyers ahead of the key data/events scheduled for this, which in turn can probe the XAU/USD upside.
Key data, events could challenge Gold buyers
While the aforementioned catalysts keep the Gold buyers hopeful, a cautious mood ahead of this week’s key catalysts could probe the metal’s immediate upside. Among the headline factors, Federal Reserve (Fed) Chairman Jerome Powell’s half-yearly Testimony and the US employment report for February are crucial for clear directions. Also important are inflation data from China.
Should Fed Chair Powell defends his hawkish bias and the US Nonfarm Payrolls (NFP) offers a positive surprise, together with an absence of any negatives from other employment details, the Gold price may witness a pullback.
Gold price technical analysis
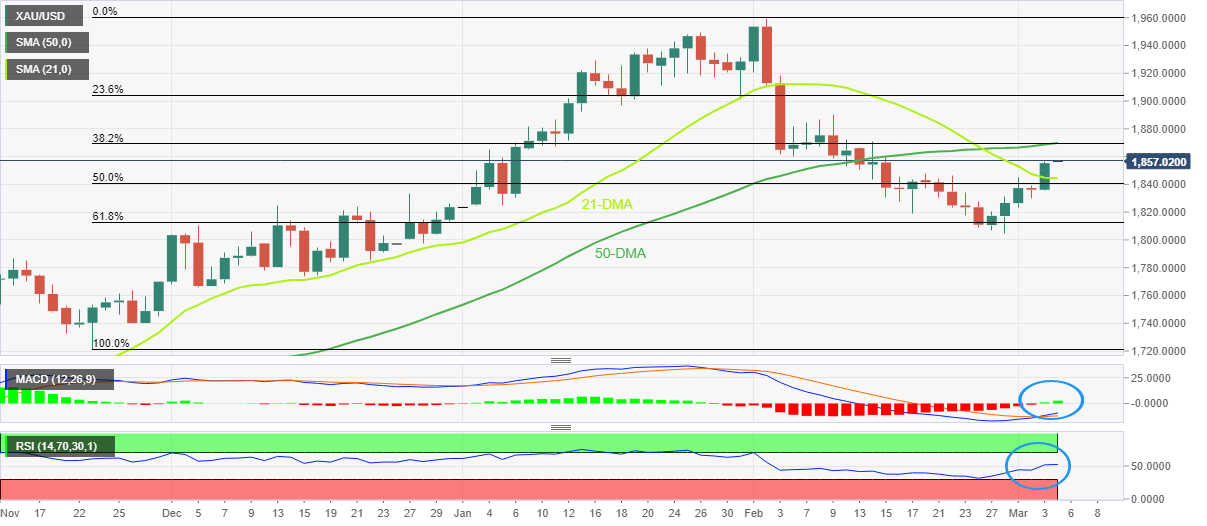
Gold price defends the previous day’s successful rebound from the 61.8% Fibonacci retracement level of November 2022 to February 2023 upside.
Adding strength to the upside bias was the metal’s successful closing beyond the 21-DMA for the first time in a month. Furthermore, the Moving Average Convergence and Divergence (MACD) flashed the first bullish signal in a five weeks while the Relative Strength Index (RSI), placed at 14, also crosses the 50 mid-line to suggest strength in the upside momentum.
As a result, the XAU/USD price is likely to continue the latest run-up towards the $1,870 resistance confluence, including the 50-DMA and 38.2% Fibonacci retracement.
It should be noted that the early February’s swing high around $1,890 and the $1,900 threshold could challenge the Gold buyers past $1,870 hurdle, a break of which could direct the bulls towards the 2023 peak surrounding $,1960.
Alternatively, a fresh Gold price weakness needs to break of the 21-DMA support of near $1,844, as well as provide a daily closing below the 50% Fibonacci retracement level of around $1,840 to recall the sellers.
Even so, the XAU/USD bears remain off the table unless the quote remains beyond the 61.8% Fibonacci retracement level close to $1,812, also known as the golden Fibonacci ratio.
Gold price: Daily chart
Trend: Further upside expected
Author

Anil Panchal
FXStreet
Anil Panchal has nearly 15 years of experience in tracking financial markets. With a keen interest in macroeconomics, Anil aptly tracks global news/updates and stays well-informed about the global financial moves and their implications.