Gold Price Forecast: XAU/USD bulls eye 2023 top as Credit Suisse turmoil drowns yields
- Gold price picks up bids to reverse the day-end pullback from six-week high.
- Risk aversion underpins XAU/USD price as banking crisis reaches Europe with Credit Suisse in target.
- United States 10-year Treasury bond yields drop the most in four months, two-year counterpart renews six-month low.
- US Dollar’s gains fail to weigh on Gold price amid mixed United States statistics.

Gold price (XAU/USD) buyers flex muscles around $1,920, after refreshing the highest levels in 1.5 months during a stellar show of Credit Suisse (CS) inflicted risk aversion the previous day. The risk profile deteriorates more as the CS episode follows the latest fallouts of Silicon Valley Bank (SVB) and Signature Bank. Given the precious metal’s haven status, the Gold buyers even ignored the jump in the US Dollar prices amid a broad downward move in the United States Treasury bond yields.
Credit Suisse drama propels Gold price via United States Treasury bond yields
With the United States banking crisis reaching the old continent Europe, via a G-SIB – a global systemically important bank, namely Credit Suisse (CS), global market players fear the return of the 2008 financial crisis and rushed for risk-safety. The risk-aversion drowned the US Treasury bond yields but propelled the Gold price, as well as the US Dollar Index (DXY).
The Saudi National Bank’s rejection of infusing more funds into Credit Suisse propelled the key European bank’s Credit Default Swaps (CDS) and triggered the crisis for the financial markets on Wednesday. On the same line was the news that the European Central Bank (ECB) officials contacted banks to ask about exposures to Credit Suisse, which in turn fanned the risk-off mood.
That said, the US 10-year Treasury bond yields dropped the most in four months before bouncing off a four-month low to 3.46% at the latest. On the same line, the US two-year bond coupons refreshed a six-month low before ending the volatile Wednesday near 3.89%.
Elsewhere, the US Dollar Index (DXY) bounced off the 50-DMA to portray the biggest daily gains in a week before ending the day at around 104.75.
It should be noted that the European stock market closed in the red but Wall Street closed mixed as the Swiss National Bank (SNB) stepped forward to help CS.
As a result, the yellow metal rallied to refresh the multi-day high earlier on Wednesday before the SNB news allowed XAU/USD bulls to take a breather.
US data fails to impress XAU/USD traders
Amid the broad fears surrounding Credit Suisse, as well as the woes of another financial crisis, traders paid little heed to the United States data.
US Retail Sales dropped to -0.4% in February versus -0.3% expected and upwardly revised 3.2% prior while the Producer Price Index (PPI) slide to 4.6% YoY from 5.7% in January and 5.6% market forecasts. Further, NY Empire State Manufacturing Index dropped to -24.6 for March compared to analysts’ estimations of -8.0 and -5.8 prior.
Even so, global rating giant Moody’s expects the Federal Open Market Committee (FOMC) to raise the federal funds rate by 25 basis points at its March 22 meeting, per Reuters.
ECB, Risk catalysts are the key
Moving on, the second-tier data surrounding employment and activities from the United States may entertain the Gold traders. However, major attention will be given to the headlines surrounding Credit Suisse and the market’s fears of another financial crisis, which in turn could keep the XAU/USD firmer. Also important to watch will be the European Central Bank’s (ECB) action considering the latest banking fiasco in the bloc.
Also read: ECB Preview: Set for 50 bps rate hike, Lagarde holds the key
Gold technical analysis
Having bounced off the 100-DMA in the last week, the Gold price crossed the 50-DMA hurdle on Monday. The follow-on corrective pullback couldn’t last long and the fresh recovery rose past the two-month-old horizontal hurdle surrounding $1,920 which holds the key for the metal’s run-up towards the Year-To-Date (YTD) high of near $1,960.
Although the Moving Average Convergence and Divergence (MACD) indicator flashes bullish signals and back the latest run-up, overbought conditions of the Relative Strength Index (RSI) line, placed at 14, suggests the bulls are running out of steam.
Hence, the XAU/USD’s further upside appears difficult but the occurrence of the same could challenge the 61.8% Fibonacci Expansion (FE) of the Gold price run-up from November 2022 to February 2023, around $2,017.
On the flip side, pullback moves remain unimpressive till the quote stays beyond the $1,900 threshold, a break of which could help the Gold sellers to aim for the 50-DMA support of $1,875.
In a case where the Gold price remains weak past $1,875, the early March high surrounding $1,858 precedes the 100-DMA support of $1,818 to challenge the XAU/USD bears.
Overall, the Gold price remains firmer but the road toward the north appears long and bumpy.
Gold price: Daily chart
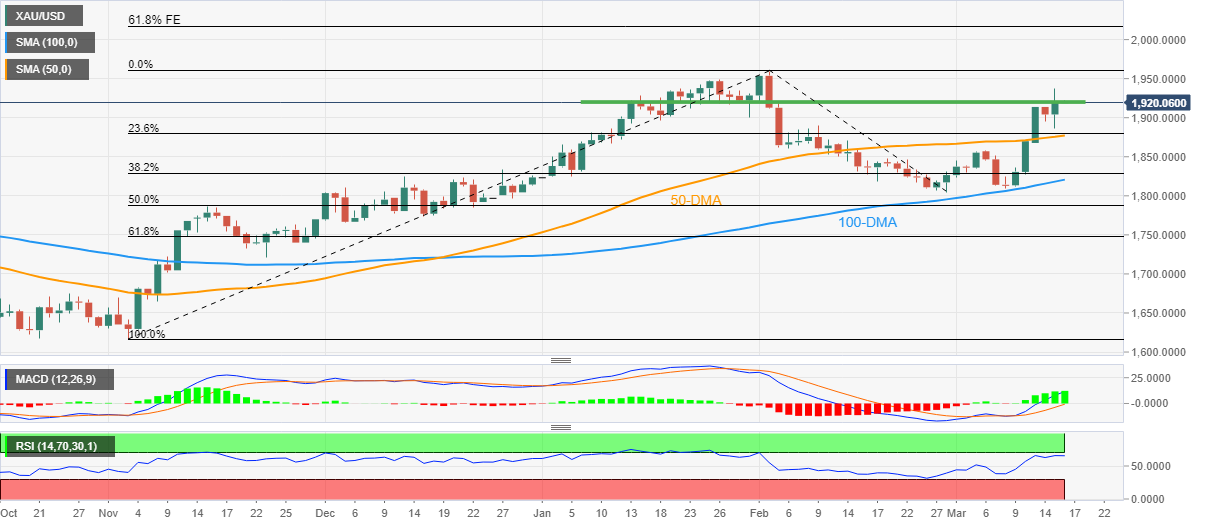
Trend: Further upside expected
Author

Anil Panchal
FXStreet
Anil Panchal has nearly 15 years of experience in tracking financial markets. With a keen interest in macroeconomics, Anil aptly tracks global news/updates and stays well-informed about the global financial moves and their implications.
















