Gold Price Forecast: XAU/USD braces for bumpy south-run towards $1,900 as key United States statistics loom
- Gold Price remains pressured at three-week low after breaking key support confluence.
- Firmer US Dollar, Treasury bond yields weigh on XAU/USD price ahead of United States activity, employment clues.
- Upbeat US ADP Employment Change, US credit rating woes join likely weak physical Gold demand from Asia to favor sellers.
- Firmer prints of US ISM Services PMI, Factory Orders and Q2 Unit Labor Costs will favor XAU/USD bears before NFP.

Gold Price (XAU/USD) languishes at the lowest level since July 12, making rounds to $1,935 after breaking the $1,945 support confluence, as bears lick their wounds ahead of a slew of United States statistics scheduled for release on Thursday. That said, a jump in the US Treasury bond yields and the US Dollar weighed on the Gold Price the previous day. While tracing the catalysts, the market’s fears emanating from the Fitch Ratings’ downgrade to the US credit rating, the US Treasury’s testing of the market’s acceptance and the upbeat Automatic Data Processing (ADP) Employment Change for July gained major attention.
Gold Price drops as US Dollar cheers upbeat United States employment data, strong yields
Gold Price dropped for the second consecutive day to the lowest level in three weeks as the Fitch Ratings’ downgrade to the US government credit rating flagged fears of the US default and weighed on the sentiment, which in turn bolstered the US Dollar’s haven demand and weighed on the Gold Price. Apart from the haven demand, upbeat prints of the US ADP Employment Change and a run-up in the Treasury bond yields also favored the US Dollar, as well as weighed on the XAU/USD.
Late on Wednesday, US Treasury Secretary Janet Yellen and White House (WH) Economic Adviser Jared Bernstein defended the credibility of the US Treasury bonds and vouched for the US economic strength after Fitch Ratings’ cited such concerns as the catalysts for their downgrade to the US government credit ratings.
On the same line, the US Treasury Department raised possibilities of testing demand for the US bonds after the rating cut by fueling the weekly longer-term debt issuance.
Elsewhere, US ADP Employment Change for July rose past 189K markets forecasts to 324K while the previous readings were revised down to 455K.
Amid these plays, US 10-year Treasury bond yields rose to the highest level since November 2022 while the US Dollar Index (DXY) also jumped to a three-week top, which in turn weighed on the Gold Price. It should be noted that the Wall Street benchmarks also closed in the red and portrayed risk aversion while favoring the XAU/USD bears.
Gold sellers seek more clues to confirm Federal Reserve rate hike in September
Although the firmer US Treasury bond yields and the US Dollar keep the Gold sellers hopeful, the Greenback buyers need more clues to defend the latest strength as markets brace for Friday’s United States Nonfarm Payrolls (NFP).
As a result, today’s US ISM Services PMI, Factory Orders, Weekly Initial Jobless Claims and quarterly readings of Nonfarm Productivity and Unit Labor Costs will be crucial to watch for the Gold traders. Should these figures keep coming in firmer, the markets can expect a firmer US NFP and increase their bets on the Federal Reserve (Fed) rate hike in September, which in turn will favor the US Dollar and weigh on the Gold Price.
Also read: Gold Price Forecast: XAU/USD pressuring a critical support level
Gold Price Technical Analysis
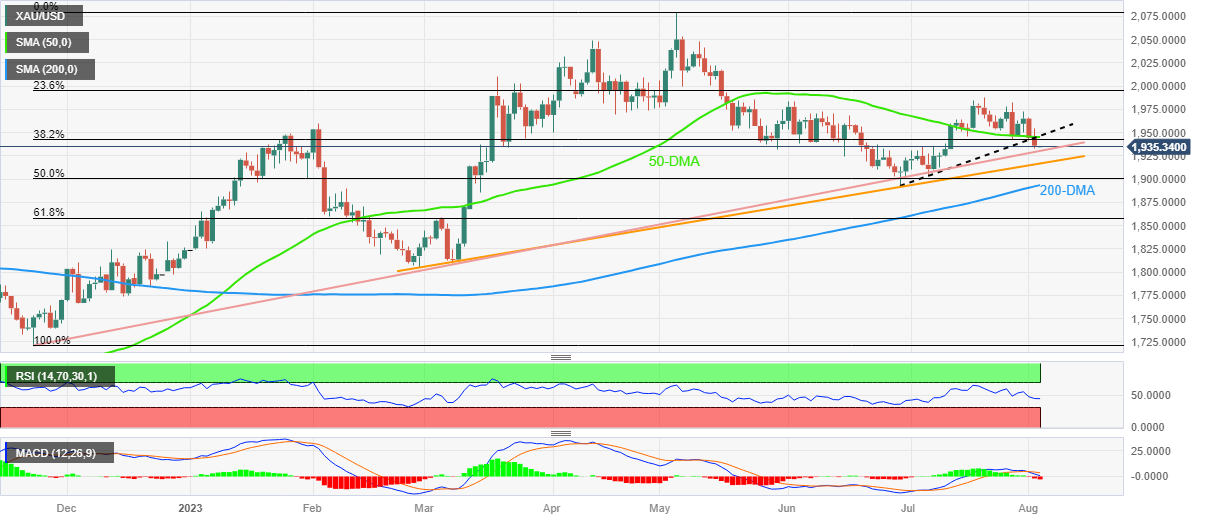
Gold Price offered a clear break of the $1,945 support confluence, now resistance, and welcomed bears on Wednesday.
Adding strength to the downside bias for the XAU/USD price is the descending Relative Strength Index (RSI) line, placed at 14, as well as bearish signals from the Moving Average Convergence and Divergence (MACD) indicator.
With this, the Gold sellers prod an ascending support line from late November 2022, close to $1,930 by the press time, a break of which could drag the bullion prices to a five-month-long rising trend line, near $1,918 at the latest.
In a case where the XAU/USD remains weak past $1,918, the 50% Fibonacci retracement of its November 2022 to May 2023 upside, around the $1,900 round figure, will precede the 200-DMA support of $1,892 to offer the last fight to the bears before the bull’s surrender.
On the contrary, a daily closing beyond the $1,945 resistance confluence comprising the 50-DMA and a five-week-old upward-sloping trend line, could direct the Gold Price toward February’s peak of around $1,960.
It’s worth observing, however, that the Gold Price remains on the bear’s radar unless crossing the previous monthly high surrounding $1,988.
Overall, the Gold Price is likely to witness further downside but the road towards the south is long and bumpy.
Gold Price: Daily chart
Trend: Further downside expected
Author

Anil Panchal
FXStreet
Anil Panchal has nearly 15 years of experience in tracking financial markets. With a keen interest in macroeconomics, Anil aptly tracks global news/updates and stays well-informed about the global financial moves and their implications.


