Gold Price Forecast: XAU/USD bears keep reins below $1,645 hurdle – Confluence Detector
- Gold price fades bounce off 29-month low amid risk-aversion.
- GBP/USD slump, hawkish Fedspeak and Russia-inspired geopolitical fears weigh on prices.
- Sustained trading below the monthly pivot, middle Bollinger Band keeps sellers hopeful.

Gold price (XAU/USD) drops back towards the recently flashed two-year low near $1,626 as sour sentiment joins hawkish Fedspeak to propel the US Dollar Index. While Russia-linked geopolitical concerns are the headline challenge to the market, the recent slump in the multiple currencies versus the US dollar, especially the British Pound (GBP), also adds to the risk-off mood. Furthermore, firmer US PMIs and hawkish Fedspeak are the extra catalysts that favor the US dollar bulls and weigh on the bullion prices of late. However, this week’s speech from Fed Chairman Jerome Powell will be crucial for clear directions as traders sense a pullback in the greenback.
Also read: Gold Price Forecast: XAU/USD seems vulnerable to test sub-$1,600 levels
Gold Price: Key levels to watch
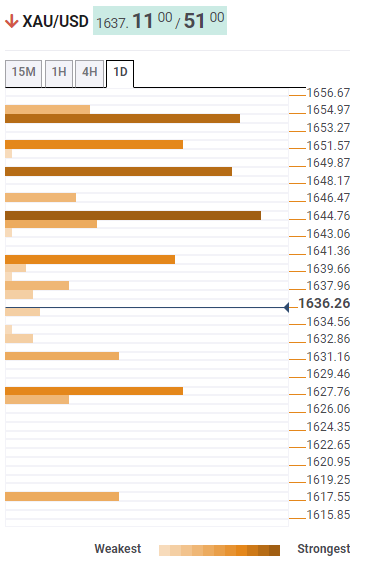
The Technical Confluence Detector shows that the gold price remains comfortably below the $1,645 support-turned-resistance confluence comprising the middle band of the hourly Bollinger and the pivot point one month S2.
That said, the previous day’s low and the SMA10 on 1H guards the quote’s immediate upside near the $1,640 mark.
It should also be noted that multiple hurdles beyond $1,645 could challenge the XAU/USD bulls. Among them, a convergence of the Fibonacci 38.2% on one-day and SMA10 on 4H offers a strong resistance near $1,655.
On the contrary, the pivot point one-day S1 joins the lower band of the hourly Bollinger to highlight $1,631 as the immediate support.
Following that, the previous low 4H joins the pivot point one week S1 constituting $1,627 as the key support.
Overall, gold is likely to remain weak unless staying successfully beyond $1,645.
Here is how it looks on the tool
About Technical Confluences Detector
The TCD (Technical Confluences Detector) is a tool to locate and point out those price levels where there is a congestion of indicators, moving averages, Fibonacci levels, Pivot Points, etc. If you are a short-term trader, you will find entry points for counter-trend strategies and hunt a few points at a time. If you are a medium-to-long-term trader, this tool will allow you to know in advance the price levels where a medium-to-long-term trend may stop and rest, where to unwind positions, or where to increase your position size.
Author

Anil Panchal
FXStreet
Anil Panchal has nearly 15 years of experience in tracking financial markets. With a keen interest in macroeconomics, Anil aptly tracks global news/updates and stays well-informed about the global financial moves and their implications.


