- Gold bears slow down around the key horizontal support after posting the biggest daily fall in a week.
- Pullback in yields probe commodity bears even as US stock futures remain pressured.
- Inflation, covid and geopolitics are crucial factors to watch for fresh impulse.
- Gold Price Forecast: Unbeatable dollar set to keep appreciating
Having dropped the most in a week, gold (XAU/USD) prices seesaw around the short-term key horizontal support area near $1,850 as market sentiment dwindles during early Tuesday. Even so, the yellow metal remains on the bear’s radar as fears surrounding inflation and growth remain on the table, as well as due to the quote’s first daily closing below 200-day EMA since late January.
Although the US stock futures track Wall Street’s losses by dropping half a percent by the press time, a pullback in the Treasury yields seemed to have probed the market pessimism of late. That said, the US 10-year Treasury yields drop back to sub-3.0% levels after rising to the fresh high since November 2018 the previous day.
Mixed comments from the Fed policymakers could be spotted as weighing on the Treasury yields of late. That said, Richmond Fed President Thomas Barkin kept the 75 bps rate hike on the table while Atlanta Fed’s Raphael Bostic promoted a series of 50bps rate lifts.
Also likely to have probed the further downside of the metal are comments from China’s Vice Premier Liu He who reiterates the country’s dynamic covid zero policy.
It’s worth noting that growing concerns over the economic growth, as rallying inflation pushes central bankers towards tighter monetary policies, seemed to have portrayed a stellar show of risk-aversion on Monday. Adding to the sour sentiment were worsening covid conditions in China and Russia’s ignorance of global ire over the invasion of Ukraine.
Looking forward, gold traders should pay attention to the risk catalysts for fresh impulse ahead of the US Consumer Price Index (CPI) data for April, scheduled for release on Wednesday.
Technical analysis
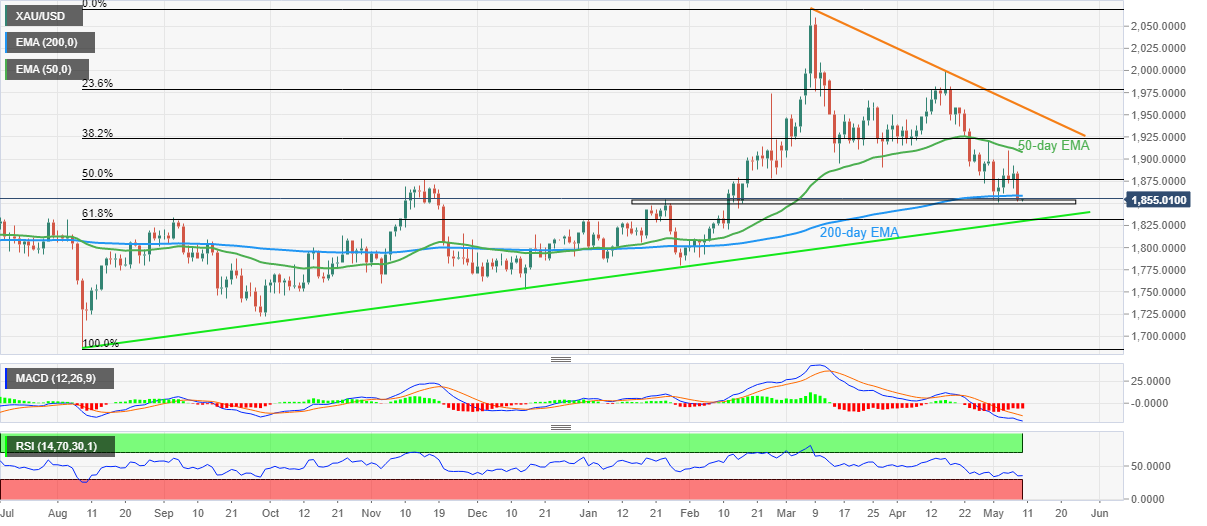
Although a horizontal area comprising multiple levels marked since late January challenges gold sellers around $1,850, a daily closing below the 200-day EMA and an absence of oversold RSI, as well as bearish MACD signals, suggest further downside of the bright metal.
However, a convergence of an upward sloping trend line from August 2021 and 61.8% Fibonacci retracement of August 2021 to March 2022 upside, near $1,832-34, appears a tough nut to crack for the gold bears.
Alternatively, corrective pullback needs validation from the 200-day EMA level surrounding $1,860.
Even so, the 50-day EMA and a descending trend line from March, respectively around $1,908 and $1,960, could challenge gold buyers.
Gold: Daily chart
Trend: Further weakness expected
Information on these pages contains forward-looking statements that involve risks and uncertainties. Markets and instruments profiled on this page are for informational purposes only and should not in any way come across as a recommendation to buy or sell in these assets. You should do your own thorough research before making any investment decisions. FXStreet does not in any way guarantee that this information is free from mistakes, errors, or material misstatements. It also does not guarantee that this information is of a timely nature. Investing in Open Markets involves a great deal of risk, including the loss of all or a portion of your investment, as well as emotional distress. All risks, losses and costs associated with investing, including total loss of principal, are your responsibility. The views and opinions expressed in this article are those of the authors and do not necessarily reflect the official policy or position of FXStreet nor its advertisers. The author will not be held responsible for information that is found at the end of links posted on this page.
If not otherwise explicitly mentioned in the body of the article, at the time of writing, the author has no position in any stock mentioned in this article and no business relationship with any company mentioned. The author has not received compensation for writing this article, other than from FXStreet.
FXStreet and the author do not provide personalized recommendations. The author makes no representations as to the accuracy, completeness, or suitability of this information. FXStreet and the author will not be liable for any errors, omissions or any losses, injuries or damages arising from this information and its display or use. Errors and omissions excepted.
The author and FXStreet are not registered investment advisors and nothing in this article is intended to be investment advice.
Recommended content
Editors’ Picks
EUR/USD stays in positive territory above 1.0850 after US data
![EUR/USD stays in positive territory above 1.0850 after US data](https://editorial.fxstreet.com/images/Markets/Currencies/Majors/EURUSD/money-euro-and-dollar-banknotes-17371247_XtraSmall.jpg)
EUR/USD clings to modest daily gains above 1.0850 in the second half of the day on Friday. The improving risk mood makes it difficult for the US Dollar to hold its ground after PCE inflation data, helping the pair edge higher ahead of the weekend.
GBP/USD stabilizes above 1.2850 as risk mood improves
![GBP/USD stabilizes above 1.2850 as risk mood improves](https://editorial.fxstreet.com/images/Markets/Currencies/Majors/GBPUSD/strong-pound-weak-dollar-17536259_XtraSmall.jpg)
GBP/USD maintains recovery momentum and fluctuates above 1.2850 in the American session on Friday. The positive shift seen in risk mood doesn't allow the US Dollar to preserve its strength and supports the pair.
Gold rebounds above $2,380 as US yields stretch lower
![Gold rebounds above $2,380 as US yields stretch lower](https://editorial.fxstreet.com/images/Markets/Commodities/Metals/Gold/gold-gm187363896-28836378_XtraSmall.jpg)
Following a quiet European session, Gold gathers bullish momentum and trades decisively higher on the day above $2,380. The benchmark 10-year US Treasury bond yield loses more than 1% on the day after US PCE inflation data, fuelling XAU/USD's upside.
Avalanche price sets for a rally following retest of key support level
![Avalanche price sets for a rally following retest of key support level](https://editorial.fxstreet.com/images/Avalanche/Avalanche_XtraSmall.jpg)
Avalanche (AVAX) price bounced off the $26.34 support level to trade at $27.95 as of Friday. Growing on-chain development activity indicates a potential bullish move in the coming days.
The election, Trump's Dollar policy, and the future of the Yen
![The election, Trump's Dollar policy, and the future of the Yen](https://editorial.fxstreet.com/images/Macroeconomics/Events/US%20Elections/Donald_Trump_closeup_XtraSmall.jpg)
After an assassination attempt on former President Donald Trump and drop out of President Biden, Kamala Harris has been endorsed as the Democratic candidate to compete against Trump in the upcoming November US presidential election.