- Gold price is looking to recapture the $1,850.00 resistance despite quiet market mood.
- The USD Index failed to capitalize on escalating geopolitical tensions.
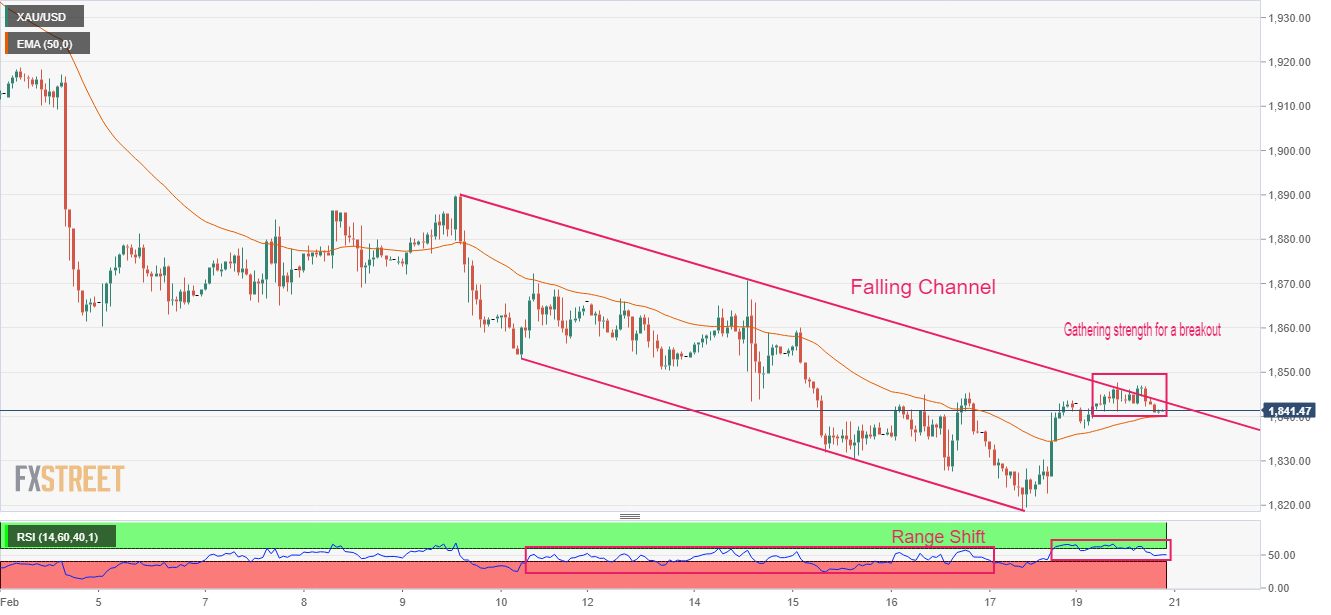
- Gold price is gathering strength to deliver a breakout of the Falling Channel.
Gold price (XAU/USD) has displayed a back-and-forth action in a narrow range above $1,840.00 on Monday’s session. The precious metal is expected to hit the critical resistance of $1,850.00 as investors have digested the fact that the United States inflation could display a surprise rebound after declining consecutively for the past six months.
Last week, the release of the higher-than-anticipated Producer Price Index (PPI) indicated that firms believe that consumer spending is still solid and that wholesale inflation should not be declined extensively. Robust demand from households due to the upbeat labor market is going to keep the expectations of a rebound in the Consumer Price Index (CPI) alive ahead.
Meanwhile, the US Dollar Index (DXY) managed to safeguard the critical support of 103.50. The USD Index didn’t pick strength despite rising geopolitical tensions. The market mood was quiet as the US markets were closed on account of Presidents’ Day. S&P500 futures displayed a volatile session amid uncertainty inspired by an elongated weekend.
For further guidance, investors will focus on the preliminary S&P PMI (Feb) data, which will release on Tuesday. The preliminary Manufacturing PMI (Feb) is seen lower at 46.8 vs. the prior release of 46.9. And the Services PMI is seen at 46.6 against the former release of 46.8.
Gold technical analysis
Gold price is oscillating near the upper end of the Falling Channel chart pattern on an hourly scale. The precious metal is gathering strength to deliver a breakout for a fresh upside. A breakout of the aforementioned chart pattern indicates a bullish reversal. The 50-period Exponential Moving Average (EMA) at $1,840.00 is acting as major support for the Gold bulls.
Meanwhile, the Relative Strength Index (RSI) (14) has demonstrated a range shift structure. The RSI (14) has shifted its structure from the bearish segment of 20.00-60.00 to the bullish arena of 40.00-60.00, in which the 40.00 will act as a support for the US Dollar bulls.
Gold hourly chart
Information on these pages contains forward-looking statements that involve risks and uncertainties. Markets and instruments profiled on this page are for informational purposes only and should not in any way come across as a recommendation to buy or sell in these assets. You should do your own thorough research before making any investment decisions. FXStreet does not in any way guarantee that this information is free from mistakes, errors, or material misstatements. It also does not guarantee that this information is of a timely nature. Investing in Open Markets involves a great deal of risk, including the loss of all or a portion of your investment, as well as emotional distress. All risks, losses and costs associated with investing, including total loss of principal, are your responsibility. The views and opinions expressed in this article are those of the authors and do not necessarily reflect the official policy or position of FXStreet nor its advertisers. The author will not be held responsible for information that is found at the end of links posted on this page.
If not otherwise explicitly mentioned in the body of the article, at the time of writing, the author has no position in any stock mentioned in this article and no business relationship with any company mentioned. The author has not received compensation for writing this article, other than from FXStreet.
FXStreet and the author do not provide personalized recommendations. The author makes no representations as to the accuracy, completeness, or suitability of this information. FXStreet and the author will not be liable for any errors, omissions or any losses, injuries or damages arising from this information and its display or use. Errors and omissions excepted.
The author and FXStreet are not registered investment advisors and nothing in this article is intended to be investment advice.
Recommended content
Editors’ Picks
EUR/USD stays below 1.0900 as Q1 comes to an end

EUR/USD has lost its traction and declined below 1.0900 in the American session on Friday. Quarter-end flows seem to be allowing the US Dollar find some demand but the risk-positive market environment seems to be limiting the pair's downside ahead of the weekend.
GBP/USD trades below 1.2400, looks to post weekly gains

GBP/USD has edged lower after having tested 1.2400 earlier in the day but remains on track to end the third straight week in positive territory. The upbeat mood remains intact after soft PCE inflation data from the US, making it difficult for the US Dollar to continue to gather strength.
Gold tries to stabilize near $1,980 following earlier spike

Gold price has returned to the $1,980 area following a spike above $1,987 with the initial reaction to lower-than-expected PCE inflation figures from the US. Meanwhile, the benchmark 10-year US Treasury bond yield stays in the red near 3.5%, providing support to XAU/USD.
Will Dogecoin price pull an XRP and rally 60% next week?

Dogecoin price has been in a tight range bound movement since November 22. The recent recovery above the range low looks promising and hints at an explosive move for next week.
Week ahead – Nonfarm payrolls to set the tone for US dollar

With the banking turmoil receding, market participants will turn their attention back to economic releases. The spotlight will fall on the US employment report.