Gold Price Forecast: XAU/USD remains on firm grounds in a 50% Fibo retracement
- Gold extends two-day rebound from a monthly low, recently picking up bids.
- Market sentiment dwindles amid inflation, Fed rate hike chatters.
- Fed’s Powell cites upbeat economic momentum, robust labor market to back the pledge against inflation.
- Gold Price Forecast: Quick pullback from 1,800 area hints at further slides

Update: Gold (XAU/USD) bulls have run up a 50% mean reversion of the prior daily bearish impulse. This is a significant milestone.
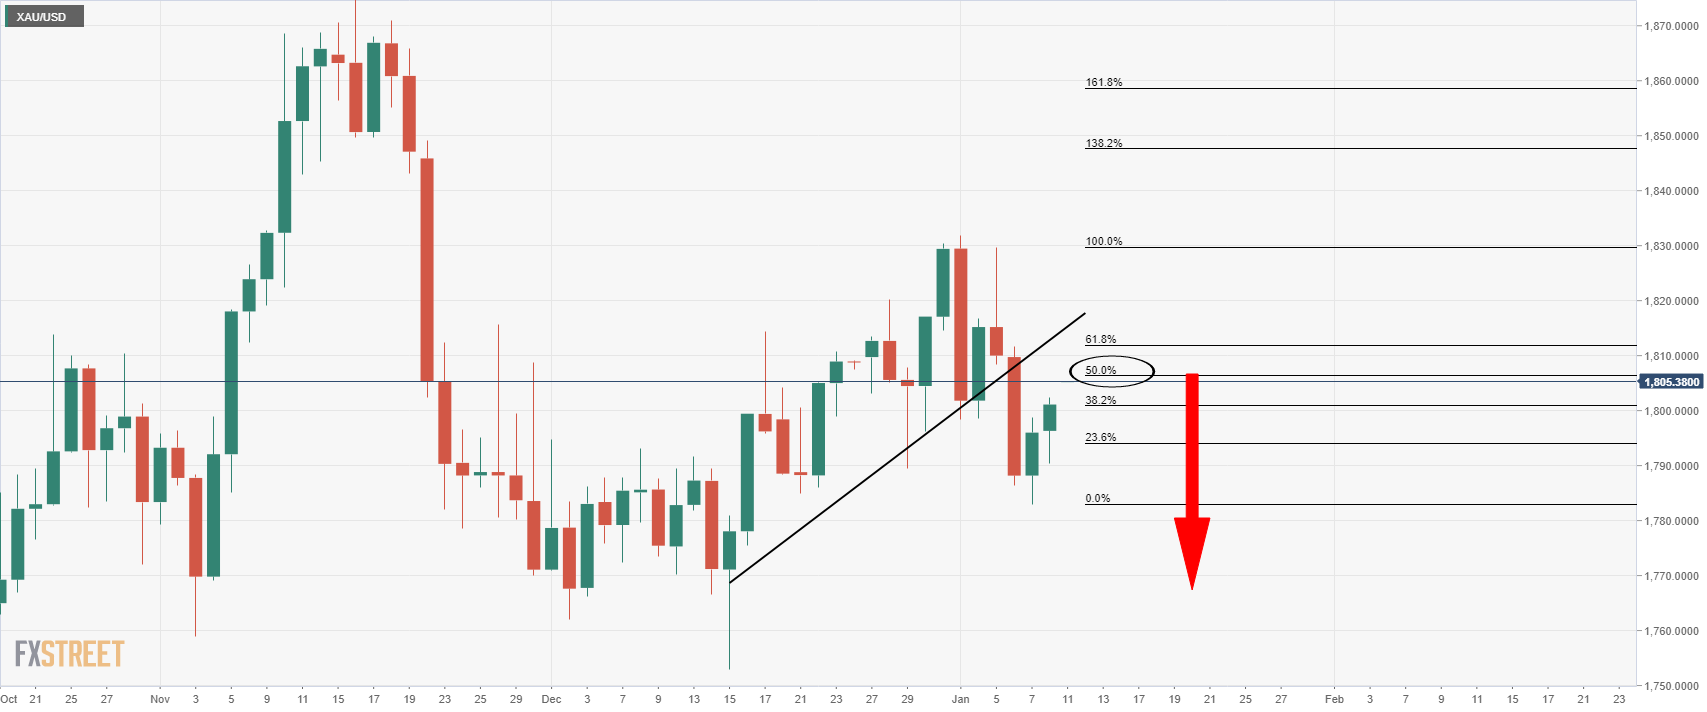
As illustrated, the price fell below dynamic trendline support on the daily chart. It has since moved into restest the prior lows. This area, to $1,810, would now be expected to act as resistance. Meanwhile, the markets will not await Federal reserve Jerome Powell’s testimony today and Wednesday’s US Consumer Price Index (CPI) data.
End of update.
Gold (XAU/USD) picks up bids to $1,802 during a quiet Asian session on Tuesday, keeping the previous two-day advances.
The bullion rose during the last two days as markets braces for this week’s US inflation data and the US Treasury yields have been on the defensive despite the refreshing multi-day high of late.
The gold’s latest upside takes clues from mildly bid S&P 500 Futures and softer US 10-year Treasury yields. That said, the US stock futures rise 0.12% while the benchmark bond yields drop one basis point (bp) to 1.77% after easing from the yearly peak the previous day.
Behind the recent market optimism are the hawkish comments from Fed Chair Jerome Powell, per the prepared remarks for today’s Testimony. The Fed Boss said, “The economy is growing at its fastest rate in years, and the labor market is robust,” to back his pledge to stop higher inflation from getting entrenched.
Additionally, comments from Merck’s official saying, “Expect Molnupiravir mechanism to work against omicron, any covid variant,” could also be cited as positive for the risk appetite.
Previously, steady US inflation expectations, as per 10-Year Breakeven Inflation Rate numbers from the Federal Reserve Bank of St. Louis (FRED), joined higher inflation components of the December NY Fed’s survey of consumer expectations to portray inflation fears. The same propelled US bond coupons to refresh multi-day peaks and drown the equities before providing a mixed daily closing.
Looking forward, gold traders will keep their eyes on Powell’s testimony for intraday moves even as the prepared remarks are out. However, major attention will be given to Wednesday’s US Consumer Price Index (CPI) data for fresh impulse.
Read: Inflation and rising yields to guide investors
Technical analysis
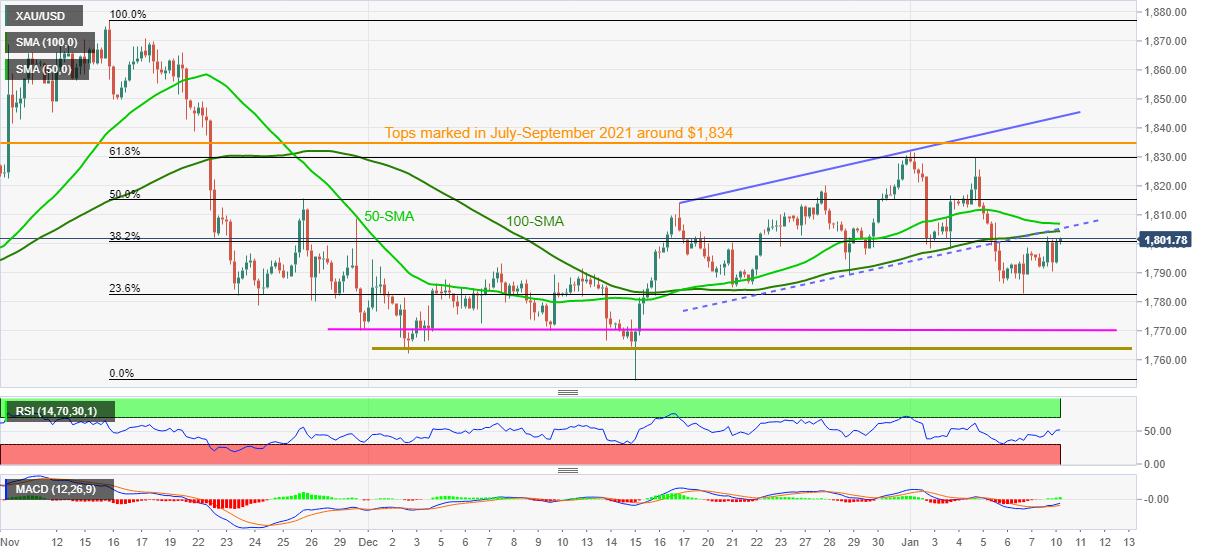
Having confirmed a bearish bias by breaking a short-term ascending trend channel and 100-SMA support, gold prices bounced off 23.6% Fibonacci retracement (Fibo.) of November-December declines. However, the metal remains below a convergence of the stated support-turned-resistance, around $1,805, amid sluggish MACD and RSI lines to keep sellers hopeful.
That said, the 23.6% Fibo. retest, near $1,782, acts as immediate support during the quote’s fresh declines, before directing gold bears towards the $1,770 and $1,760 levels.
In a case where gold prices remain weak past $1,760, December’s low of $1,753 and September’s bottom surrounding $1,721 will be in focus.
Alternatively, recovery moves remain elusive below $1,805 resistance confluence, previous support. Also challenging gold buyers is the 50-SMA near $1,808 and 50% Fibonacci retracement level of $1,815.
Given the gold buyer’s dominance past $1,815, 61.8% Fibonacci retracement level around $1,830 may act as an immediate resistance before the tops marked in July and September of 2021, close to $1,834. Also acting as an upside filter is the upper line of the ascending trend channel, close to $1,843.
Overall, gold’s failure to keep Friday’s corrective pullback hints at the commodity’s further weakness.
Gold: Four-hour chart
Trend: Further weakness expected
Author

Anil Panchal
FXStreet
Anil Panchal has nearly 15 years of experience in tracking financial markets. With a keen interest in macroeconomics, Anil aptly tracks global news/updates and stays well-informed about the global financial moves and their implications.
















