Gold Price Forecast: XAU/USD appears pressured towards $1,890 – Confluence Detector
- Gold price prints four-day downtrend as US Dollar licks its wounds near multi-day low.
- Failure to stay beyond $1,910 hurdle keeps XAU/USD bears hopeful amid mixed sentiment.
- Fed talks, China concerns should be watched carefully for clear directions.

Gold price (XAU/USD) remains depressed around the weekly low near the $1,900 threshold, declining for the fourth consecutive day, as the US Dollar bounces off a multi-day low amid contrasting signals from the US data and Federal Reserve (Fed) officials. Also challenging the Gold price are the mixed concerns surrounding China, one of the biggest XAU/USD consumers. Furthermore, a pause in the US Treasury bond yields amid fresh recession fears also weighs on the Gold price amid a light calendar. That said, central bankers could entertain the Gold traders ahead of the likely inactive week due to the Chinese Lunar New Year holidays.
Also read: Gold Price Forecast: Recession fears weighing on XAU/USD
Gold Price: Key levels to watch
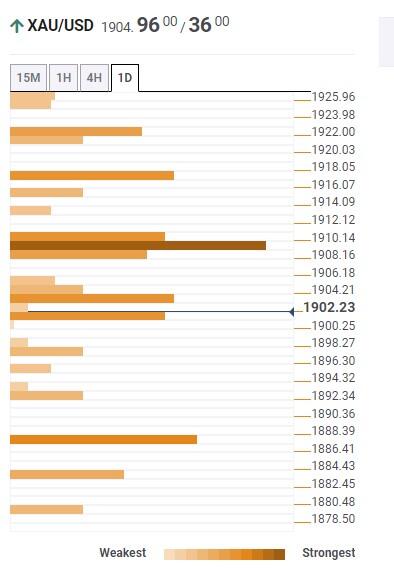
The Technical Confluence Detector shows that the gold price grinds lower past the $1,910 key resistance comprising the 50-HMA, 5-DMA and Middle band of the Bollinger on the hourly play.
Also keeping the Gold sellers hopeful is the metal’s recent dip below the previous low on the Four-hour (4H).
It’s worth noting, however, that the $1,900 threshold encompassing Fibonacci 38.2% on one week and the Lower Bollinger on 4H appears a tough nut t to crack for short-term XAU/USD bears.
Following that, a slump towards the $1,890 support confluence, including the Fibonacci 61.8% on weekly and 10-DMA, can’t be ruled out.
Meanwhile, recovery moves need validation from the $1,910 hurdle to recall the Gold buyers. Also challenging XAU/USD bulls is the Pivot point one-month R3, near $1,920.
It should be noted that the previous weekly high of around $1,925 and the $1,930 could act as the last defense of the Gold bears.
Here is how it looks on the tool
About Technical Confluences Detector
The TCD (Technical Confluences Detector) is a tool to locate and point out those price levels where there is a congestion of indicators, moving averages, Fibonacci levels, Pivot Points, etc. If you are a short-term trader, you will find entry points for counter-trend strategies and hunt a few points at a time. If you are a medium-to-long-term trader, this tool will allow you to know in advance the price levels where a medium-to-long-term trend may stop and rest, where to unwind positions, or where to increase your position size.
Author

Anil Panchal
FXStreet
Anil Panchal has nearly 15 years of experience in tracking financial markets. With a keen interest in macroeconomics, Anil aptly tracks global news/updates and stays well-informed about the global financial moves and their implications.

















