|

Gold Price Forecast: XAU/USD accelerates to near $1,930 despite upbeat hawkish Fed bets

  • Gold price has jumped to $1,930.00 amid mixed views about Fed’s interest rate guidance.
  • Investors would keep an eye on the FOMC minutes and the US Employment data.
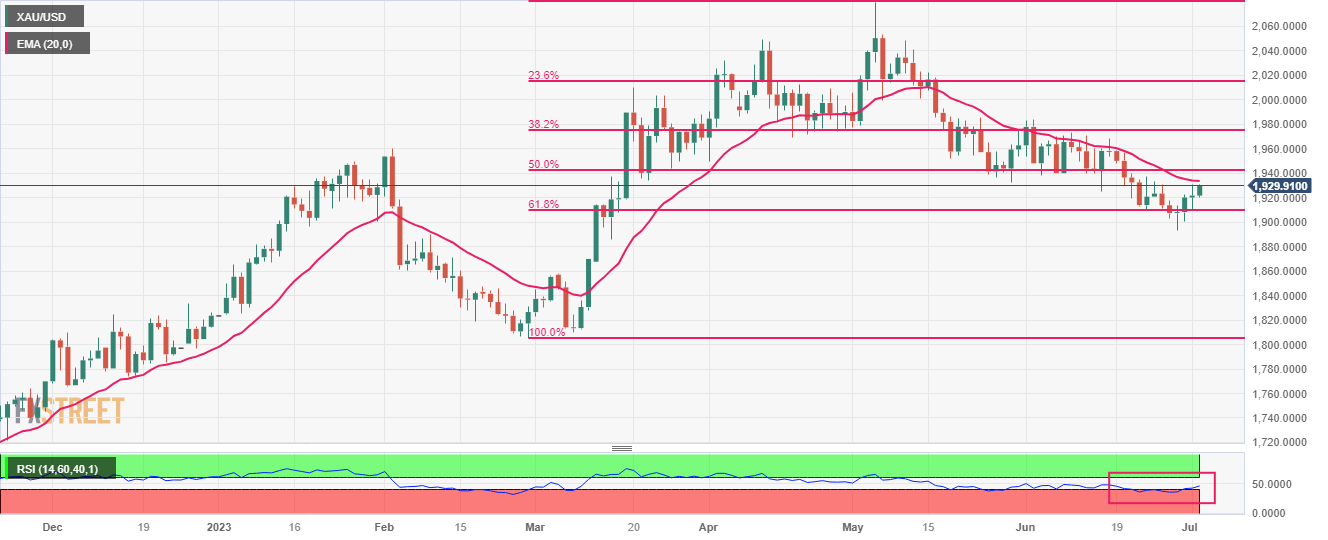
  • Gold price has rebounded from near the 61.8% Fibonacci retracement at $1,909.55.

Gold price (XAU/USD) has climbed to near $1,930.00 in the European session. The precious metal has delivered a stellar rally despite investors are anticipating a small interest rate hike by the Federal Reserve (Fed) in its July monetary policy.

S&P500 futures are holding nominal losses in London amid caution among investors ahead of second-quarter result season. The risk profile is quiet as investors are expected to deliver irrational moves once United States companies would start disclosing quarterly performance.

The US Dollar Index (DXY) is showing choppy moves around 103.00 amid mixed views about July’s interest rate decision. Fed chair Jerome Powell has already cleared that two small interest rate hikes are appropriate by year-end. While Atlanta Fed Bank President Raphael Bostic stated last week that the central bank has reached a point where interest rates are sufficiently restrictive to bring down inflation to 2%.

Going forward, investors would keep an eye on Federal Open Market Committee (FOMC) minutes. The minutes will provide a detailed explanation behind a steady interest rate policy announcement. Apart from that, cues about further interest rates and economic prospects will be keenly watched.

In addition to FOMC minutes, investors would await Automatic Data Processing (ADP) Employment data. As per the estimates, the US economy added 180K fresh payrolls in June lower than the addition of 278K made in May.

Gold technical analysis

Gold price has rebounded from near the 61.8% Fibonacci retracement (plotted from February 28 low at $1,804.76 to May 03 high at $2,079.76) at $1,909.55 on a daily scale. The 20-period daily Exponential Moving Average (EMA) at $1,933.54 is still acting as a barricade for the Gold bulls.

Meanwhile, the Relative Strength Index (RSI) (14) has jumped into the 40.00-60.00 range from the bearish range of 20.00-40.00, which indicates that the downside momentum has faded. Investors should note that the downside bias is still solid

Gold daily chart

XAU/USD

Overview
Today last price1929.82
Today Daily Change8.16
Today Daily Change %0.42
Today daily open1921.66
 
Trends
Daily SMA201936.91
Daily SMA501967.75
Daily SMA1001945.08
Daily SMA2001860.82
 
Levels
Previous Daily High1931.09
Previous Daily Low1910.11
Previous Weekly High1933.39
Previous Weekly Low1893.01
Previous Monthly High1983.5
Previous Monthly Low1893.01
Daily Fibonacci 38.2%1923.08
Daily Fibonacci 61.8%1918.12
Daily Pivot Point S11910.82
Daily Pivot Point S21899.97
Daily Pivot Point S31889.84
Daily Pivot Point R11931.8
Daily Pivot Point R21941.93
Daily Pivot Point R31952.78

Author

Sagar Dua

Sagar Dua

FXStreet

Sagar Dua is associated with the financial markets from his college days. Along with pursuing post-graduation in Commerce in 2014, he started his markets training with chart analysis.

More from Sagar Dua
Share:

Markets move fast. We move first.

Orange Juice Newsletter brings you expert driven insights - not headlines. Every day on your inbox.

By subscribing you agree to our Terms and conditions.

Editor's Picks

EUR/USD bears await break below 100-day SMA support near 1.1665 area

The EUR/USD pair attracts heavy selling for the second straight day and dives to a nearly four-week trough, around the 1.1670 region, during the Asian session on Monday. Bearish traders now await a sustained break below the 100-day Simple Moving Average before positioning for an extension of the recent pullback from a three-month top, or levels just above the 1.1800 mark touched on December 24.

GBP/USD falls toward 1.3400 near 50-day EMA

GBP/USD extends its losses for the second successive session, trading around 1.3420 during the Asian hours on Monday. The technical analysis of the daily chart indicates that the 14-day Relative Strength Index at 53 has eased from near overbought, indicating that momentum has cooled while remaining above the midline. RSI holds above 50, keeping a modest bullish bias.

Gold on fire at the start of the week on US-Venezuela tensions

Gold regains upside traction early Monday as flight to safety prevails on Venezuela turmoil. The US Dollar finds strong haven demand, caps Gold’s upside as focus shifts to US jobs data. Gold’s daily technical setup suggests that more upside remains in the offing.

Bulls firmly in control as Bitcoin breaks $93K, Ethereum and Ripple extend gains

Bitcoin, Ethereum, and Ripple extended their rallies on Monday, gaining more than 4%, 6%, and 12%, respectively, in the previous week. The top three cryptocurrencies by market capitalization could continue to outperform, with bulls in control of the momentum.

Economic outlook 2026-2027 in advanced countries: Solidity test

After a year marked by global economic resilience and ending on a note of optimism, 2026 looks promising and could be a year of solid economic performance. In our baseline scenario, we expect most of the supportive factors at work in 2025 to continue to play a role in 2026.

Crypto market outlook for 2026

Year 2025 was volatile, as crypto often is.  Among positive catalysts were favourable regulatory changes in the U.S., rise of Digital Asset Treasuries (DAT), adoption of AI and tokenization of Real-World-Assets (RWA).