Gold Price Forecast: Falling wedge lures XAU/USD bulls, focus on $1,980 and Fed inflation
- Gold Price stays firmer at four-week high, confirming the falling wedge bullish chart pattern.
- Downbeat United States data propel concerns about Federal Reserve policy pivot and fuel XAU/USD prices.
- Softer Treasury bond yields, China's stimulus also strengthen the Gold Price.
- China’s official PMI, inflation clues from Eurozone and US eyed for fresh impulse.

Gold Price (XAU/USD) prints mild gains at the highest level in four weeks while confirming a bullish chart formation on early Thursday, up 0.10% intraday near $1,945 by the press time. In doing so, the precious metal cheers the broad US Dollar weakness, as well as hopes of witnessing China's stimulus, to please the buyers. However, the cautious mood ahead of the Federal Reserve’s (Fed) preferred inflation gauge, namely the United States Core Personal Consumption Expenditure (PCE) Price Index for August, prod the XAU/USD bulls of late.
Gold Price rise on Federal Reserve policy pivot concerns, China stimulus
Gold Price attracts bids at multi-day highs, despite the latest cautious performance of the XAU/USD traders, as the recently downbeat United States data bolstered expectations of witnessing a sooner end to the Federal Reserve’s (Fed) hawkish cycle. Also favoring the Gold buyers is the firmer sentiment about China, one of the world’s biggest Gold customers.
A disappointment from the early signal of Friday’s Nonfarm Payrolls (NFP) lured the Gold buyers as the ADP Employment Change dropped to 177K compared to 195K market forecasts and 371K previous readings (revised from 324K). On the same line, the second readings of the US second quarter (Q2) Gross Domestic Product (GDP) Annualized declined to 2.1% from 2.4% initial forecasts while the GDP Price Index also eased to 2.0% versus the first readings of 2.2%. Further, the preliminary readings of the Personal Consumption Expenditures (PCE) Prices also edged lower to 2.5% from 2.6% prior estimations for the said period.
It’s worth noting that the US Consumer Confidence and activity data, as well as the housing market numbers, previously favored dovish calls about the US central bank and weighed on the US Dollar, which in turn propelled the Gold Price.
Additionally, China’s reaction to the US allegations that “it’s being risky for businesses” challenged the prior hopes of a smooth running of the Sino-American talks in Beijing, which in turn probed the XAU/USD buyers earlier on Wednesday. However, a slew of Chinese banks reduced mortgage rates and favored the hopes of witnessing more stimulus from the Asian major, which in turn repaired the damages to sentiment and defended the Gold buyers.
Against this backdrop, the US Dollar Index (DXY) dropped for three consecutive days to the lowest level in two weeks, making rounds to 103.15-10 of late. That said, the benchmark US 10-year Treasury bond yields remain pressured at the lowest levels in three weeks, around 4.11% by the press time.
Many catalysts stand tall to test XAU/USD bulls
While the dovish Fed concerns and optimism about China propel the Gold Price, a slew of economics from China and the US, as well as from the Eurozone, will test the XAU/USD buyers. Among them, China’s official NBS Manufacturing PMI and Non-Manufacturing PMI for August will be the first to challenge the metal’s upside. Following that, Eurozone inflation per the Consumer Price Index (CPI) and the European Central Bank’s (ECB) favorite gauge, namely the Harmonized Index of Consumer Prices (HICP), measures. Above all, the Fed’s preferred inflation gauge, namely the US Core Personal Consumption Expenditure (PCE) Price Index for August, will be crucial to aptly predict the Gold Price moves.
Also read: Gold Price Forecast: XAU/USD extends rally beyond $1,940
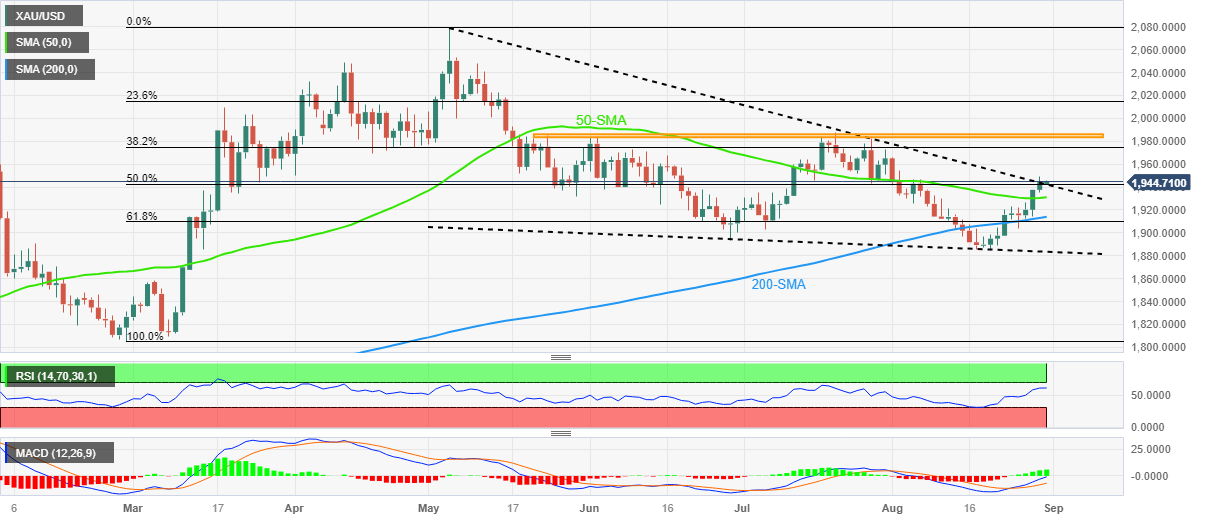
Gold Price Technical Analysis
Gold Price remains on the buyer’s radar as a confirmation of the four-month-old falling wedge bullish chart formation joins the price-positive signals from the Moving Average Convergence and Divergence (MACD) indicator and the Relative Strength Index (RSI) line, placed at 14.
It’s worth noting, however, that the RSI line is speedily approaching the overbought territory, which in turn suggests limited upside room for the XAU/USD.
As a result, a horizontal area comprising multiple levels marked since late May, around $1,984–85, and the yearly top marked in May close to $2,067, can challenge the Gold buyers during the run-up toward the theoretical target of the stated wedge breakout, near $2,140.
Meanwhile, the Gold Price pullback remains elusive unless it stays beyond the 50-day Simple Moving Average (SMA) level of $1,930.
Following that, the 200-SMA and 61.8% Fibonacci retracement of February-May upside, also known as the Golden Fibonacci Ratio, will test the XAU/USD sellers around $1,913 and $1,910 in that order.
Above all, the Gold buyers remain hopeful unless the commodity remains beyond the stated wedge’s bottom line, surrounding $1,883 by the press time.
Gold Price: Daily chart
Trend: Further upside expected
Author

Anil Panchal
FXStreet
Anil Panchal has nearly 15 years of experience in tracking financial markets. With a keen interest in macroeconomics, Anil aptly tracks global news/updates and stays well-informed about the global financial moves and their implications.


