Gold Price Forecast: XAU/USD extends rally beyond $1,940

XAU/USD Current price: $1,945.01
- Discouraging United States macroeconomic figures added pressure on the US Dollar.
- Wall Street holds on to modest gains as investors bet on the end of the tightening cycle.
- XAU/USD maintains its positive momentum, about to confirm a run towards $1,982.
The US Dollar extended its downward route across the FX board on Wednesday, pushing XAU/USD to $1,949.02 a troy ounce, its highest in four weeks. The USD slump started Tuesday when United States (US) macroeconomic data fueled speculation the Federal Reserve (Fed) will soon end its tightening cycle.
The USD decline was exacerbated by fresh figures, which came in worse than anticipated. On the one hand, the August ADP Survey on private job creation showed the sector added 177K new positions, down from 371K in the previous month. Additionally, the Q2 Gross Domestic Product (GDP) was downwardly revised to 2.1% QoQ from the prior estimate of 2.4%. The annual pace of growth was confirmed at 2%, down from the 2.2%. On a positive note, July Pending Home Sales were up 0.9%, beating expectations.
Stock markets edged higher while government bond yields retreated, as odds for an on-hold Fed next September rose to 88.5%, according to the CME FedWatch Tool.
The optimism partially receded on market talks, suggesting the Fed is pressuring regional lenders to strengthen their liquidity strategy. Wall Street retreated from its recent highs, preserving modest gains at the time of writing.
The focus now shifts to US inflation, as the country will publish the July Core Personal Consumption Expenditures (PCE) Price Index on Thursday, expected to have risen by 5.3% YoY in August, easing from the previous 5.5%. Easing inflationary pressures will reinforce the case of no more rate hikes and boost investors’ mood.
XAU/USD price short-term technical outlook
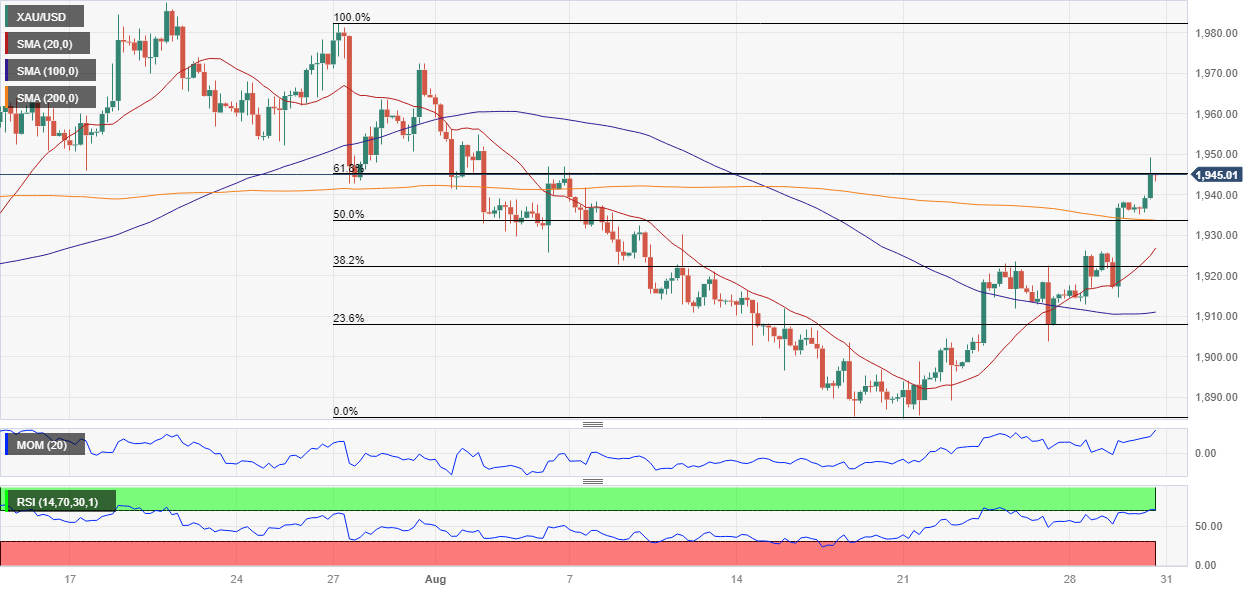
The XAU/USD pair is currently hovering around the 61.8% Fibonacci retracement of the $1,982.12/$1,884.77 decline at $1.944.85, maintaining the bullish tone. The daily chart shows that technical indicators have partially lost their upward momentum but continue to advance within positive levels. At the same time, Gold is above the 20 and 200 Simple Moving Averages (SMAs) and nears a mildly bearish 100 SMA at $1,955.80.
The 4-hour chart shows that technical indicators turned marginally lower but remain within overbought levels, not enough to confirm an interim top. In the meantime, the 200 SMA provided intraday support at the beginning of the day, while the shorter moving averages remain well below the longer one. A daily close around the current level exposes the high set in late July at $1,982.15.
Support levels: 1,933.30 1,921.80 1,907.30
Resistance levels: 1,955.80 1,972.40 1,982.15
Premium
You have reached your limit of 3 free articles for this month.
Start your subscription and get access to all our original articles.
Author

Valeria Bednarik
FXStreet
Valeria Bednarik was born and lives in Buenos Aires, Argentina. Her passion for math and numbers pushed her into studying economics in her younger years.


