Gold Price Forecast: XAU/USD re-attempts $1800 as US dollar eases with yields
- Gold bulls have been denied a free lunch from weaker US data and instead are looking into the abyss once again.
- Gold is now trading back below $1,800/oz and the US dollar is bouncing back with a vengeance.

Update: Gold price is attempting a minor bounce from weekly lows of $1792, as it battles with the $1800 mark amid a cautious market mood. Resurfacing global growth worries amid spiking Delta covid cases in the US is keeping investors on the edge, weighing on the Treasury yields, in turn, lending some support to gold price, at the time of writing. From a technical perspective, gold price is clinging onto the 21-Daily Moving Average (DMA) support, having breached the 200-DMA at $1810. A daily closing below the 21-DMA is likely to open floors towards the mid-August lows around $1775. Meanwhile, a lack of relevant US macro news will leave gold price at the hands of the risk trends and the dollar dynamics.
Gold has been dropped on its head and is trying to recovery in Asia.
XAU/USD fell from the Friday highs this week and has broken key levels son the way down, including the daily dynamic support line.
Gold is now trading at $1,796.50.
In this week's Chart of the Week, the downside risks were highlighted within the analysis, and here we are, testing back below the psychological $1,800 once again.
The Chart of the Week is a weekly publication that is released each and every Sunday GMT in the analysis section of the FXStreet website, here. It is published just ahead of the Asia Monday open.
The Chart of the Week provides analysis on what is hot for the week ahead on the charts and gives an insight to traders wishing to plan their trade ahead of time.
In the case of gold, having previously called out $1,834 as a critical target to the upside, (the top of the post-Nonfarm Payrolls data), it was forecasted that ''a drop below trendline support near $1,820 will pressure the bullish commitments in the $1,800s once again.''
This was illustrated in the following prior technical analysis:

And, this is where we are today:
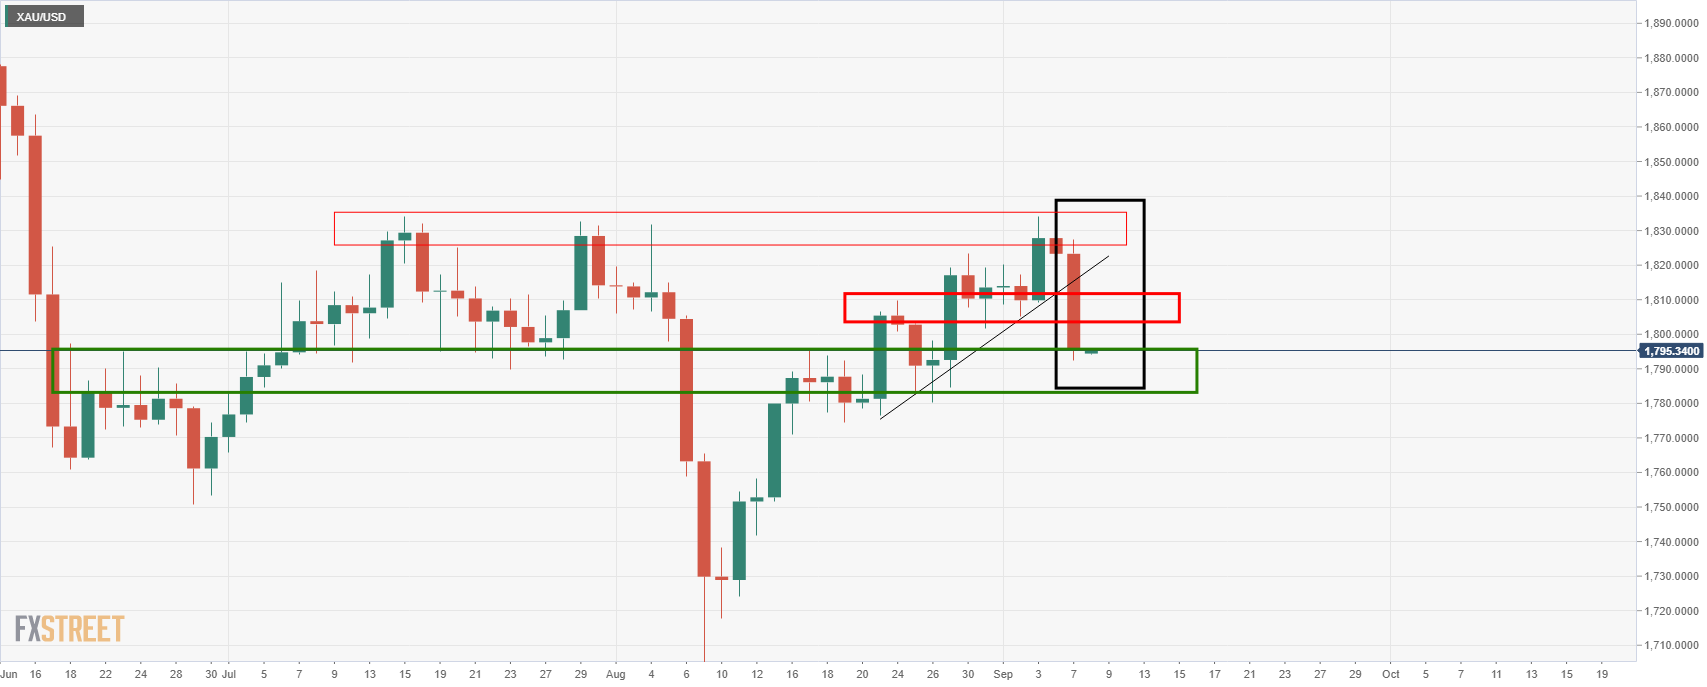
It was argued that while the bias was to the upside, the caveat was Delta variant risks.
''On the other hand, the global Delta coronavirus spread remains the biggest wild card, not to mention US and China relations.
The US dollar smile theory could bounce back with a vengeance for the currency's safe-haven allure, which would be a major headwind for gold.
In such a scenario, the $1,800s would be expected to come back under pressure, as illustrated on the daily chart above.''
Additionally, the analysis was followed up by question marks over the US dollar downside potential, as follows:
US dollar: A bearish false start?
The question that was being asked was whether the bears have jumped the gun?
It was stated that ''first and foremost, the NFP report, while terrible, was only one of many other very strong reports.''
''We don't think the report is weak enough for Fed officials to back away from their "this year" tapering signal, especially given the continued strength in wages, but we believe it increases the probability of a formal announcement coming at the Dec rather than the Nov meeting,'' analysts at TD Securities argued at the start of the week.
Additionally, it was noted that ''the US is not the only economy exposed to the risk of the delta spreading. It all goes back to relative performances.
The US dollar may hold up better than expected since a US recession would likely be part of a broader global downturn.''
Meanwhile, there are plenty of risks ahead which could also explain the sudden adjustment in the US dollar which has weighed significantly in the price of gold.
The European Central Bank is coming up on Thursday and traders long the euro have been quick to cash in for fears that the outcome might not be as hawkish as expected.
Additionally, higher bond yields weighed on investor demand for the yellow metal. This is despite rising inflation expectations, with the US 10-year breakeven bond yield hitting a one week high of 2.36%.
What might disturb this current flow into the Us dollar is attention being paid to the Delta crisis onshore.
More on this here, US dollar bears denied a free lunch post NFP fall-out, US yields surge, but it has the potential to nip this bid in the bud in coming days.
With that being said, the technicals do not favour a bullish outlook for gold, for the moment at least.
Gold technical analysis
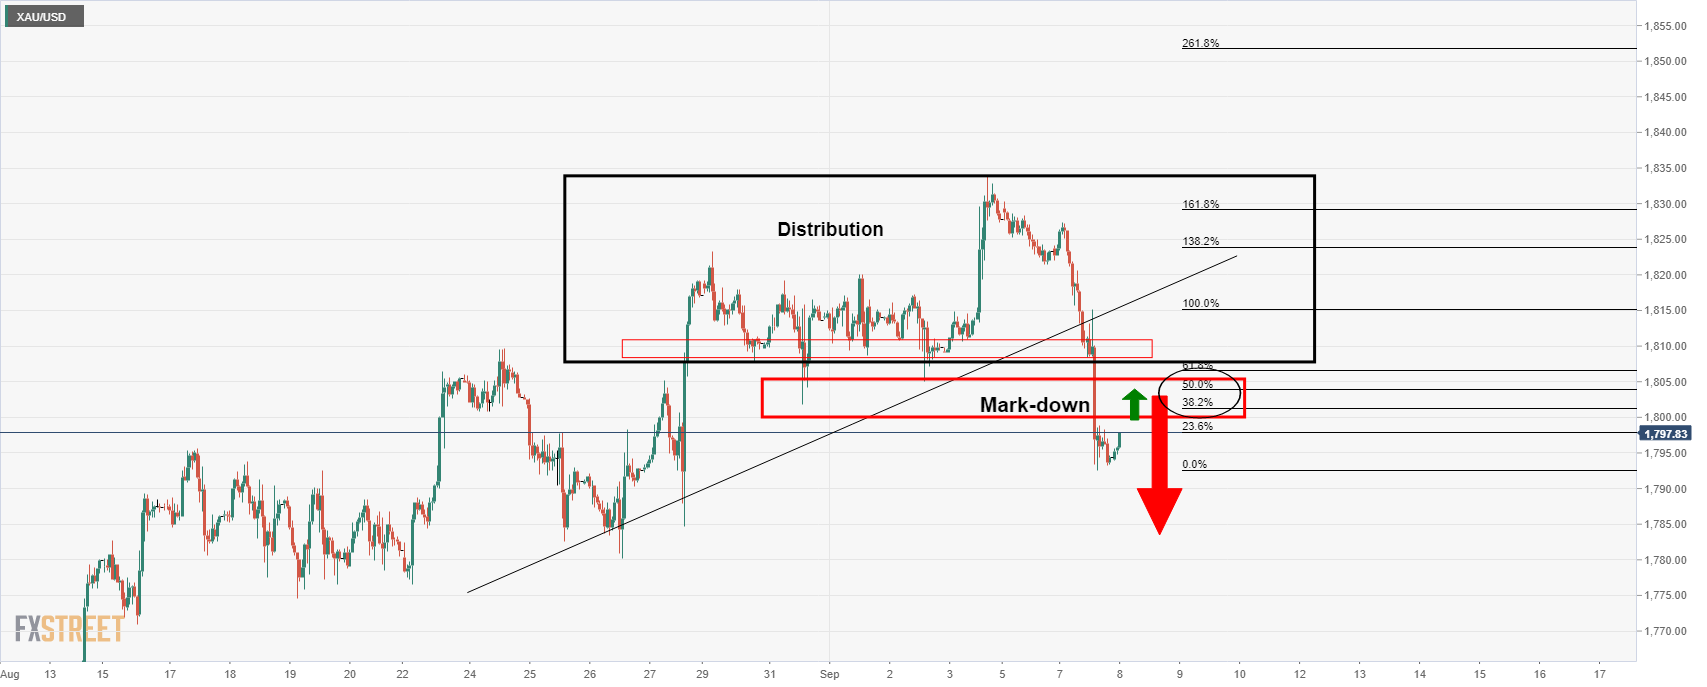
A rally to the 50% mean reversion ratio is on the cards that meet prior lows.
However, there is more of a bias to the downside from there while the price is below the counter trendline.
Author

Ross J Burland
FXStreet
Ross J Burland, born in England, UK, is a sportsman at heart. He played Rugby and Judo for his county, Kent and the South East of England Rugby team.