Chart of the Week: Game on for Gold as XAU/USD finally touches $1,834 target
- Gold has moved on a critical level of resistance at $1,834/oz.
- Investors are buying gold as the Fed's hawkish narrative and US dollar crumble.

As per prior analysis, Gold Price Forecast: XAU/USD clinging onto 200-DMA ahead of critical US NFP, whereby $1,834 was marked as a target on a disappointing Nonfarm Payrolls, the high after the data was $1,834.04.
Prior analysis
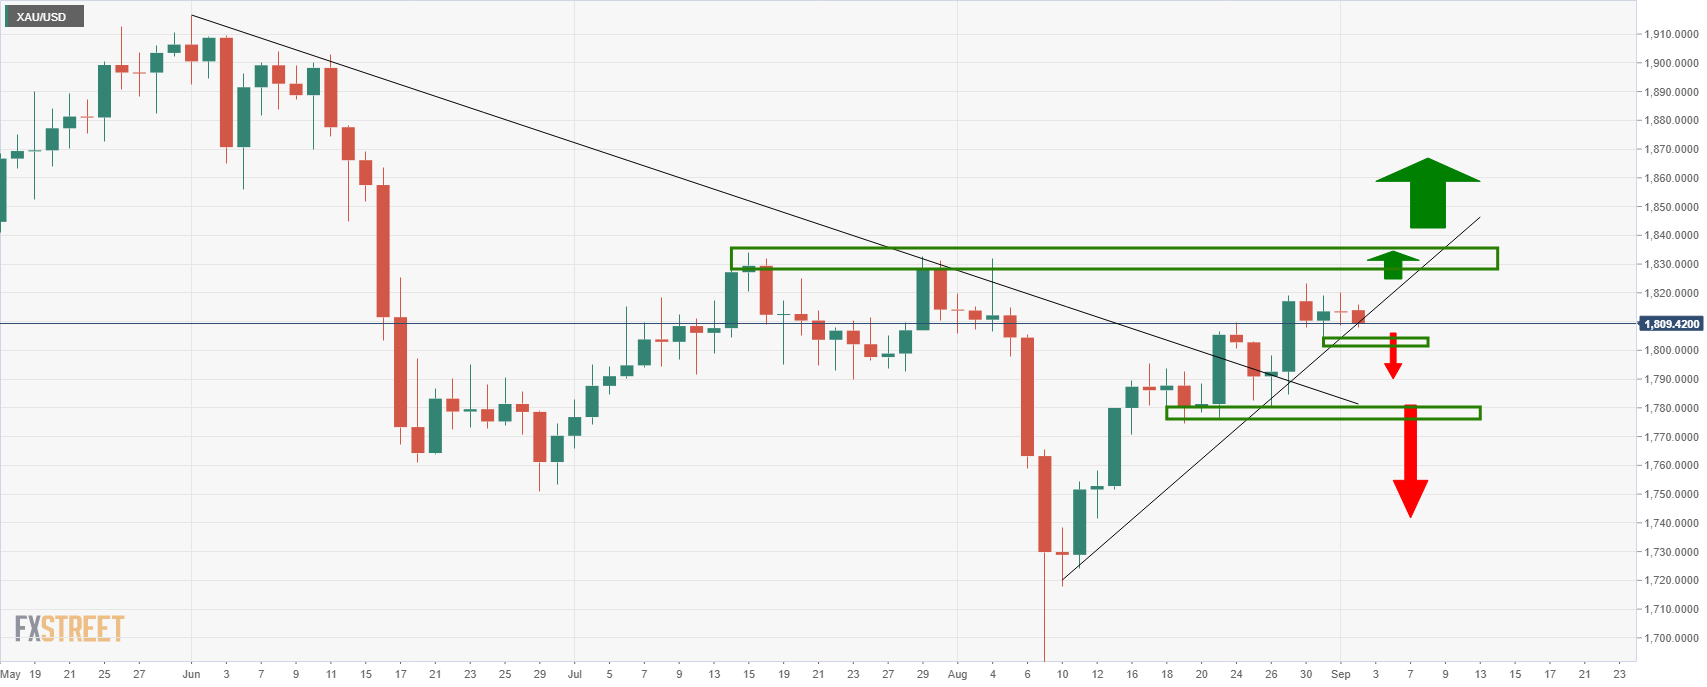
''Bulls are looking for a move above $1,834, propped up at trend line support.''
Meanwhile, as the markets soak up the data from Friday, technicians are scanning the market structures from a longer-term basis.
The following top-down analysis outlines both bullish and bearish scenarios for the gold price for the forthcoming weeks and days.
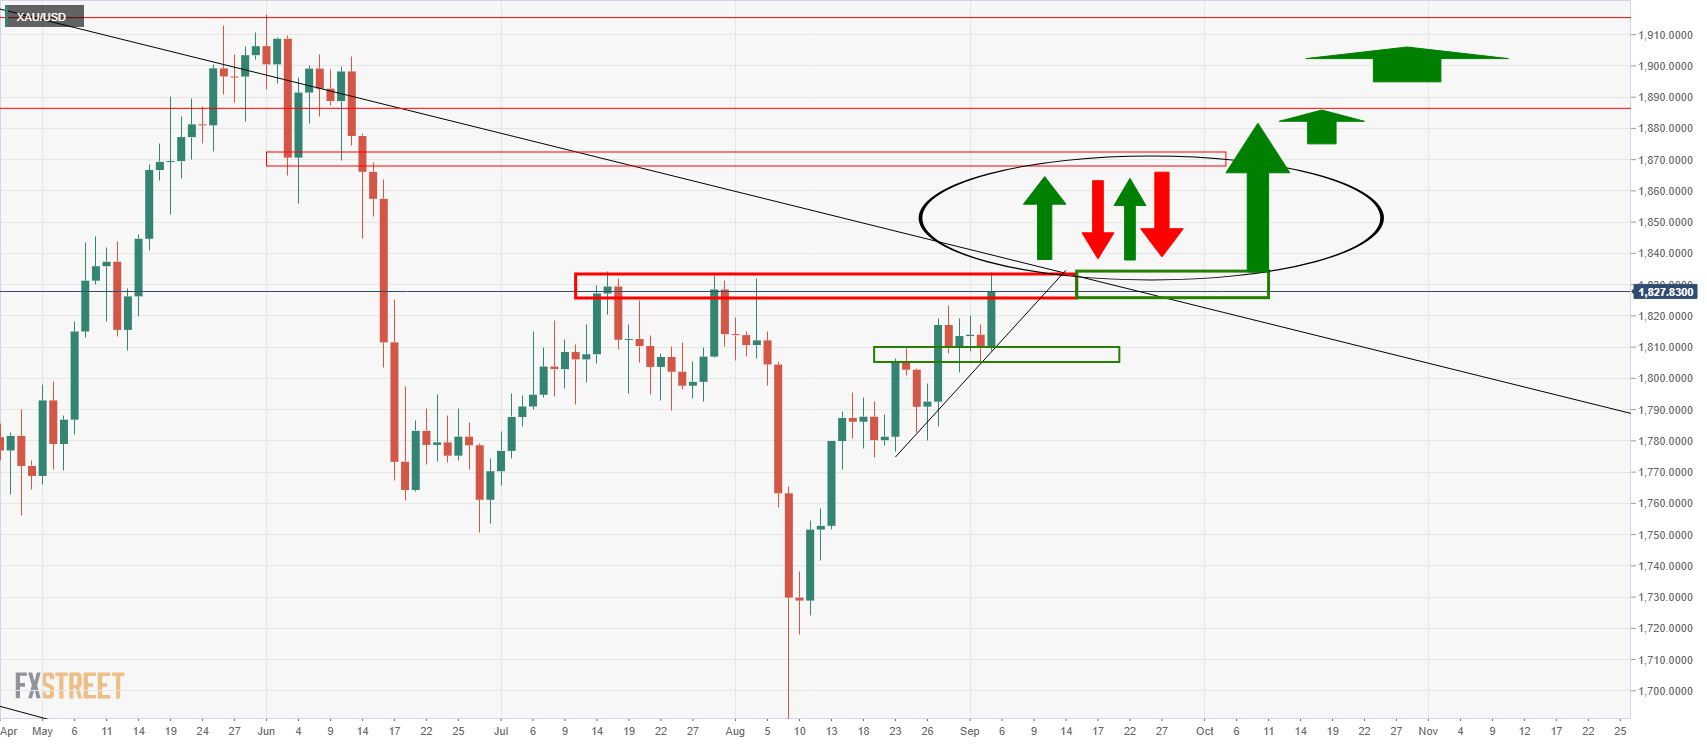
A break of current resistance $1,834 opens risk to the $1,870s that guard fresh territory to the upside.
A drop below trendline support near $1,820 will pressure the bullish commitments in the $1,800s once again.
Monthly chart
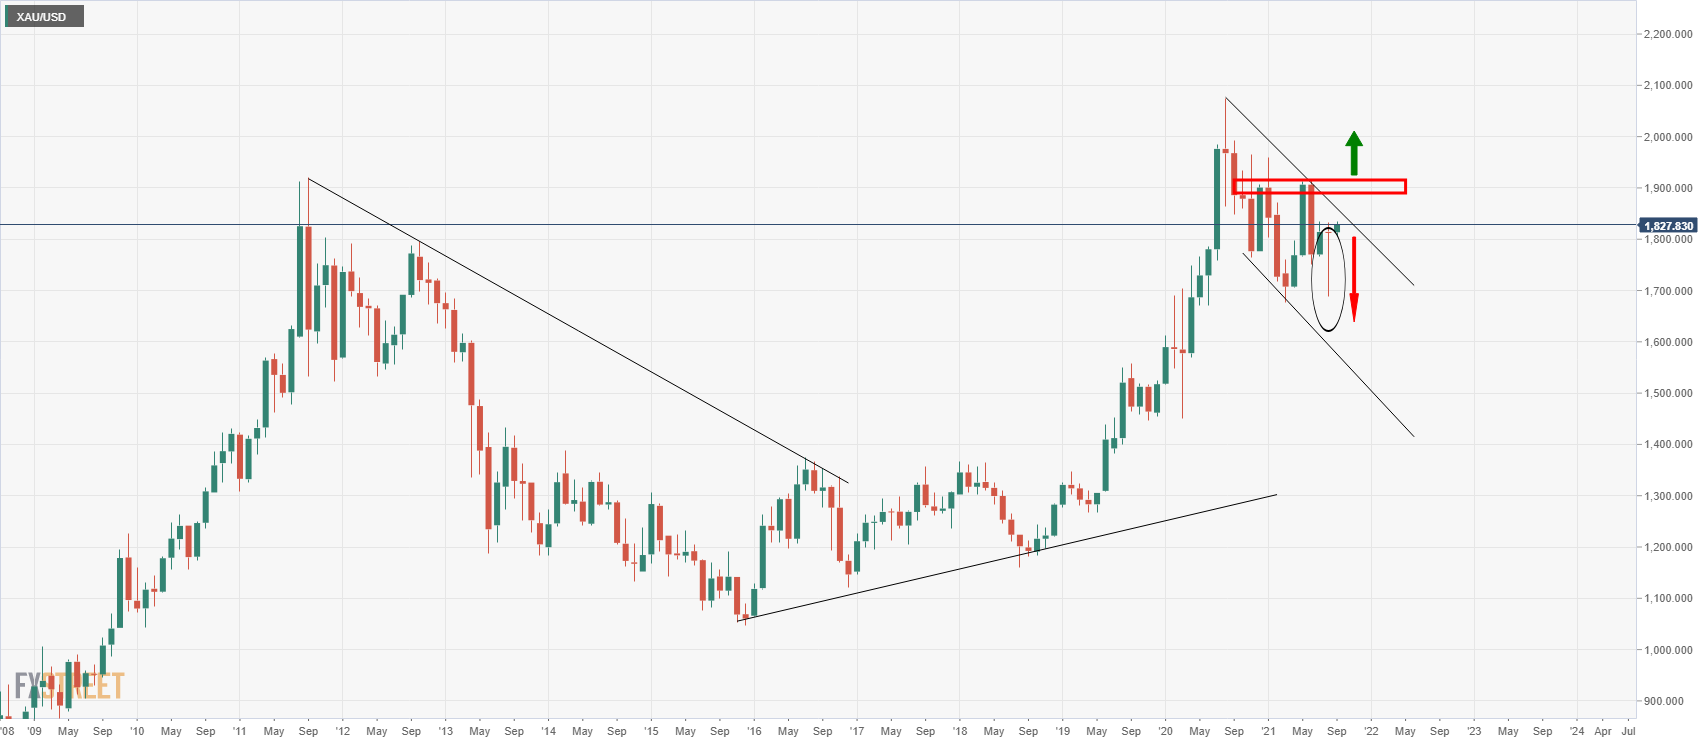
From a monthly perspective, the trend is bearish within a descending channel.
August's candle is also bearish, which leaves prospects for the wick (eclipsed on the chart above) to be filled in on the lower time frames.
Weekly chart
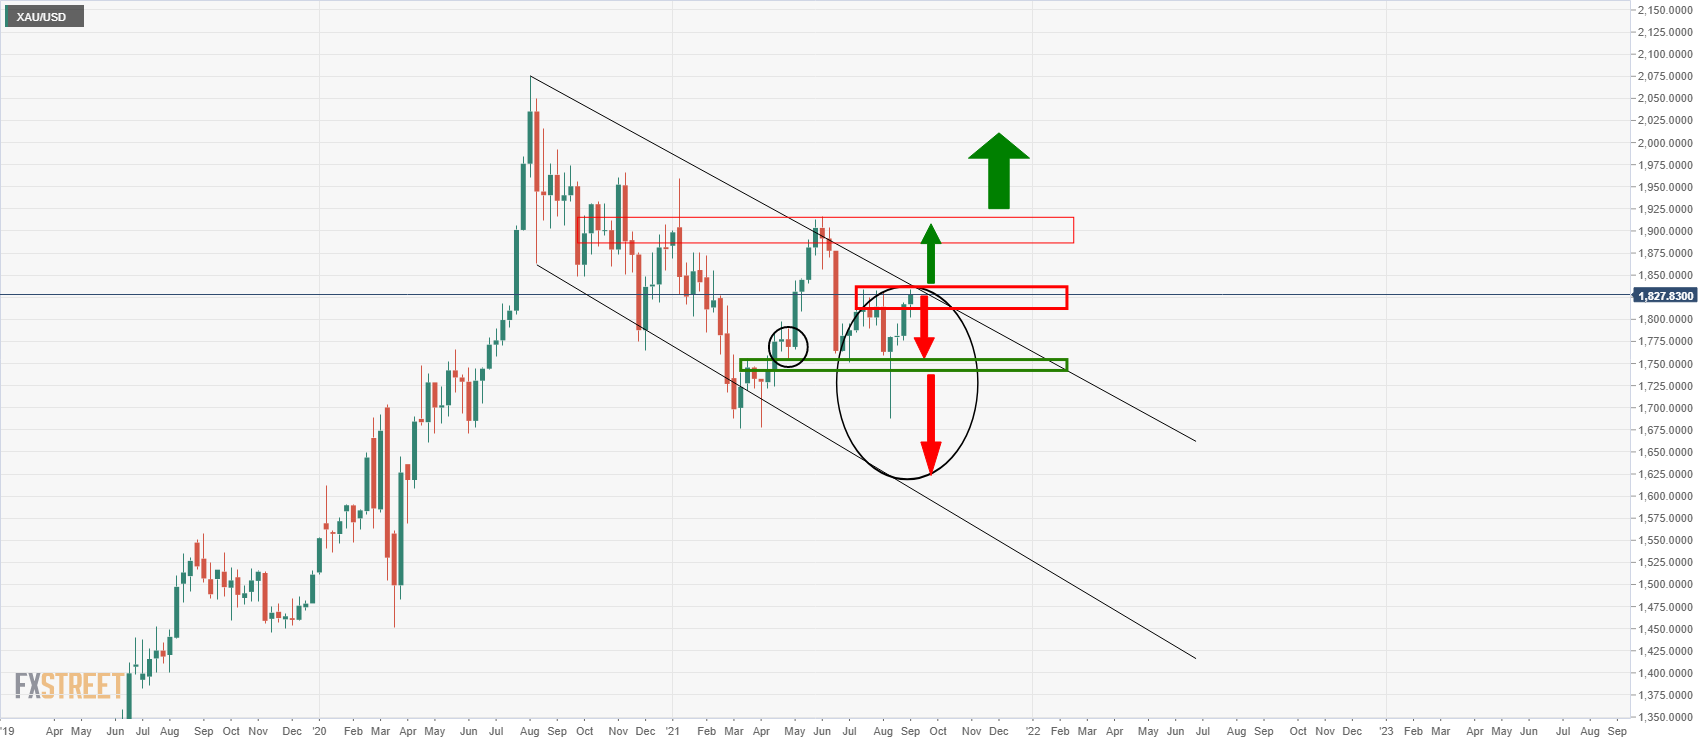
Meanwhile, it is game on from a weekly perspective.
The bulls are taking on the bears at a critical level of resistance, $1,834.
A break of this level to the upside will likely seal the deal for the bulls, at least for the near future, as it guards critical trend line resistance of the descending channel.
The $1,900s will be next in line as a key psychological and structural target area.
Daily chart
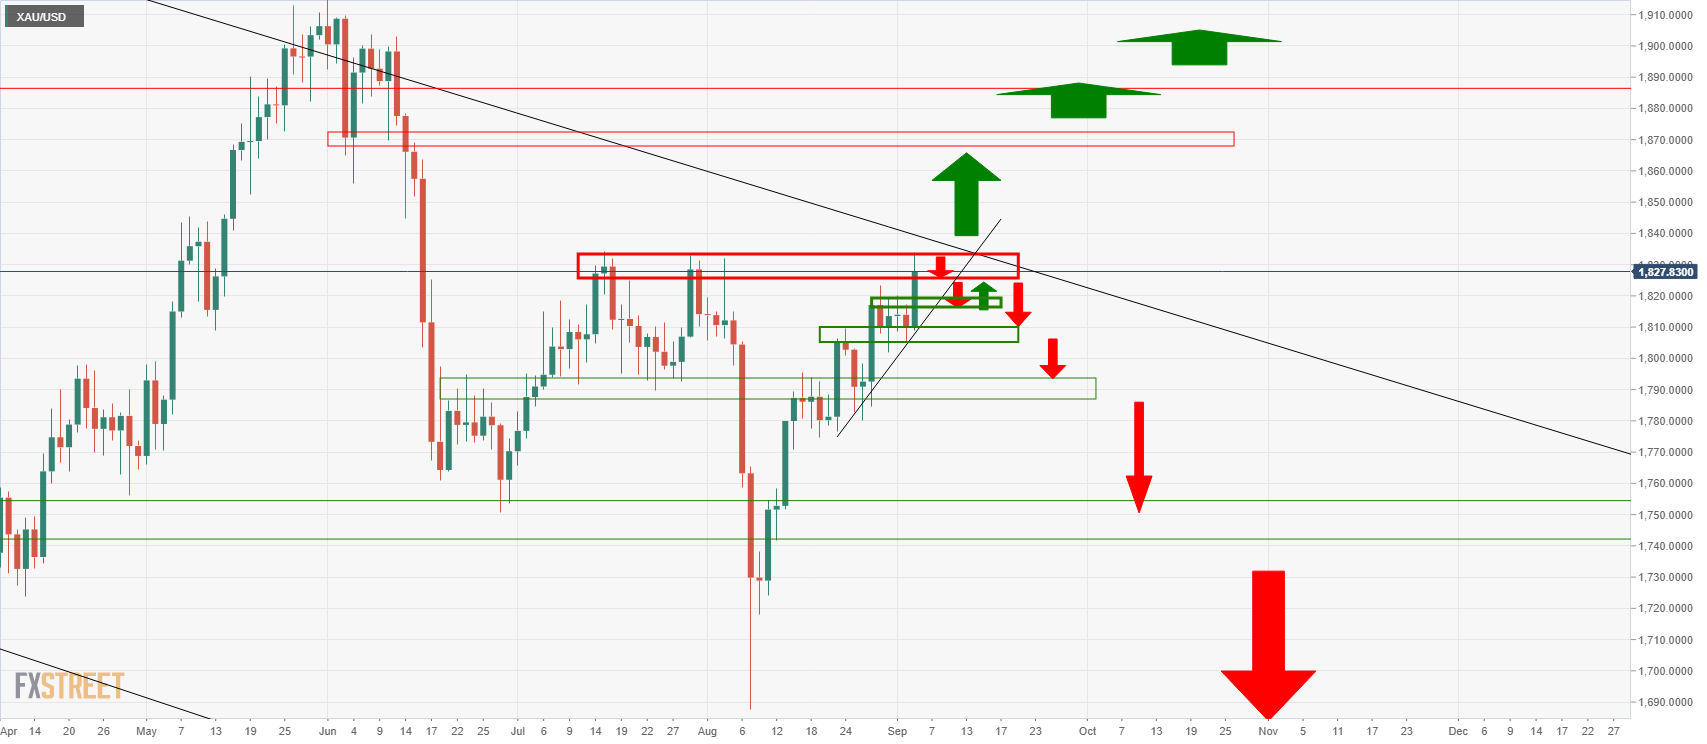
With that being said, from a daily point of view $1,870 will need to give out first.
Should the trend line break on a daily perspective, we could be in for a period of sideways price action between there and $1,870:
This scenario levels up with the current fundamentals at the moment given the convergence between central banks and the lack of urgency at the Federal Reserve to taper too soon.
Additionally, after aggressively increasing long gold exposure last week, money managers again hiked their net long holdings within $1,800 territory.
''It is likely that investors will again increase length next week,'' analysts at TD Securities argued following the dismal NFP print.
On the other hand, the global Delta coronavirus spread remains the biggest wild card, not to mention US and China relations.
The US dollar smile theory could bounce back with a vengeance for the currency's safe-haven allure, which would be a major headwind for gold.
In such a scenario, the $1,800s would be expected to come back under pressure, as illustrated on the daily chart above.
Author

Ross J Burland
FXStreet
Ross J Burland, born in England, UK, is a sportsman at heart. He played Rugby and Judo for his county, Kent and the South East of England Rugby team.