Gold Price Forecast: $1802 is a tough nut to crack on road to recovery – Confluence Detector
- Gold price attempts a tepid bounce from two-week lows.
- Gold looks to regain $1800 and beyond, as USD loses ground.
- Gold bulls remain in control following dismal NFP data.

Gold price is looking to recover lost ground while finding support near the two-week lows of $1782 earlier on. The rebound in gold price comes on the heels of a broad retracement in the US dollar from the weekly tops. Mounting economic growth concerns amid the Delta covid variant contagion have triggered a risk-off wave across the board, which boosts the US Treasuries while knocking off the yields. The weakness in the Treasury yields dragged the greenback lower against it main peers, prompting the bounce in gold.
However, the further upside appears elusive in gold price amid hawkish Fedspeak and a potential tapering by the ECB at its policy decision later this Thursday.
Read: Gold Price Forecast: XAU/USD seems vulnerable, $1,775 area holds the key for bulls
Gold Price: Key levels to watch
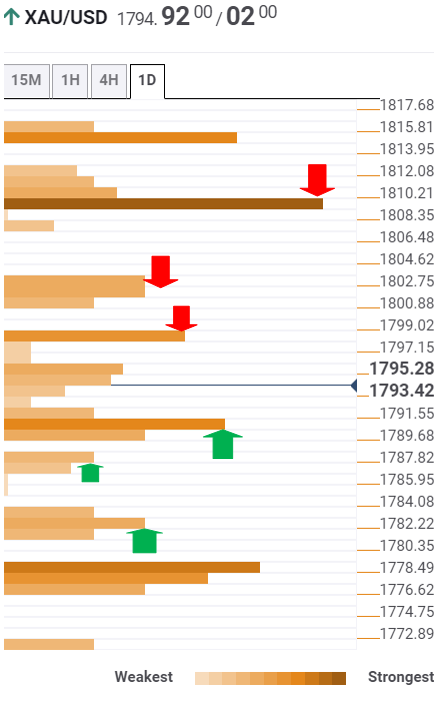
The Technical Confluences Detector shows that gold price is set to challenge powerful barrier at $1798 on its road to recovery. That level is the confluence of the SMA50 one-day and Bollinger Band one-day Middle.
Further up, the intersection of the previous week’s low, the previous day’s high and SMA100 four-hour around $1800-$1802 will offer stiff resistance to gold bulls.
Recapturing the latter will open up doors towards $1810, the critical resistance comprising of the SMA200 one-day, pivot point one-week S1 and SMA10 one-day.
Meanwhile, the immediate downside remains cushioned by the intersection of the Fibonacci 38.2% one-day, pivot point one-week S2 and SMA5 four-hour at $1790.
The next bearish target for sellers is seen at $1787, the Fibonacci 23.6% one-day.
Further south, the confluence of the previous day’s low and Fibonacci 161.8% one-week at $1782 will be the level to beat for gold bears.
Here is how it looks on the tool
About Technical Confluences Detector
The TCD (Technical Confluences Detector) is a tool to locate and point out those price levels where there is a congestion of indicators, moving averages, Fibonacci levels, Pivot Points, etc. If you are a short-term trader, you will find entry points for counter-trend strategies and hunt a few points at a time. If you are a medium-to-long-term trader, this tool will allow you to know in advance the price levels where a medium-to-long-term trend may stop and rest, where to unwind positions, or where to increase your position size.
Author

Dhwani Mehta
FXStreet
Residing in Mumbai (India), Dhwani is a Senior Analyst and Manager of the Asian session at FXStreet. She has over 10 years of experience in analyzing and covering the global financial markets, with specialization in Forex and commodities markets.


