Gold slips but stays firm above $2,400 on risk aversion
- Gold dips to $2,364, a six-day low, then recovers above $2,400.
- Market turmoil stems from weak US data, anticipates 50 bps Fed cut in September.
- US Dollar Index falls 0.50% to 102.70; 10-year Treasury yield to 3.783%.
- Rising Middle East tensions buoy Gold; US base in Iraq hit by missiles.

Gold price dropped over 1% during Monday’s North American session but recovered after hitting a new six-day low of $2,364 amid a worldwide market sell-off spurred by last week’s softer-than-expected data in the United States (US). The XAU/USD trades at $2,407, down 1.40%.
The financial markets began to price in a possible recession in the US. Traders expect the Federal Reserve (Fed) will cut interest rates by 50 basis points at the September meeting, following two “bad” reports that showed that manufacturing activity plunged, according to the Institute for Supply Management (ISM), while the economy added fewer people to the workforce.
This spooked investors, who found some relief following the ISM Services PMI release, which revealed the economy continues to expand at a healthier pace. After the data, Gold remained on the backfoot even though the Greenback remained on offer across the board.
The US Dollar Index (DXY), which tracks the performance of six currencies against the US Dollar, sinks 0.50% to 102.70.
US Treasury bond yields tanked further with the 10-year down one basis point to 3.783%. However, it still bounced off multi-week lows of 3.667% hit earlier in the session.
Rising tensions in the Middle East capped bullion losses as Israel awaits a response from Iran and Lebanon following the assassination of the Hamas leader earlier in the week. Sky News Arabia cited Iraqi sources when it revealed that a US base in Iraq was targeted by several missiles.
Daily digest market movers: Gold price stumbles amid recession fears
- A deteriorated market mood would continue to influence traders as fears of a US recession ignited a sell-off among the largest stock market indices.
- The Fed decided to hold rates unchanged last week but indicated that favorable data on inflation and further weakening in the labor market could prompt action.
- Last week, dismal data in the US spooked investors, following the ISM Manufacturing PMI and Nonfarm Payrolls.
- However, Chicago Fed President Austan Goolsbee said on Monday the Fed will not overreact to one month of data, and the board will remain committed to its dual mandate.
- After the data, most banks began to price in more aggressive monetary policy easing by the Fed. Bank of America expects the first cut in September instead of December, while Citi and JP Morgan expect the Fed to lower rates by 50 bps in September and November.
- The CME FedWatch tool shows the odds for a 50 bps Fed rate cut at the September meeting at 85%.
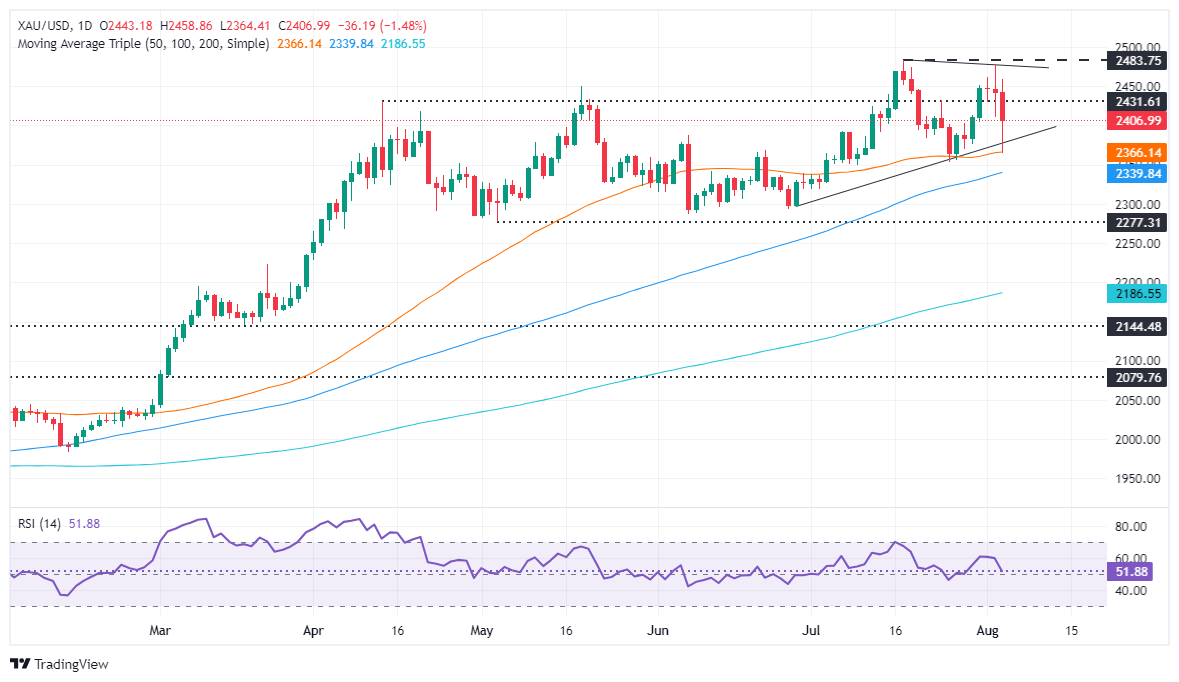
Technical analysis: Gold price tumbles but stays above $2,400
Gold price retreated to the 50-day Simple Moving Average (SMA) at $2,365 during the European session before bouncing off that level and clinched the $2,400 figure. Despite that recovery, momentum still favors sellers.
The Relative Strength Index (RSI) is about to turn bearish after falling steeply during the last three days and is about to cross below the RSI’s neutral line. Once surpassed, this could accelerate Bullion’s losses.
If XAU/USD dives below $2,400, the 50-day SMA could be challenged. Once surpassed, the next support would be the 100-day SMA at $2,340, followed by the May 3 low of $2,277.
Conversely, if buyers reclaim $2,450, the next resistance would be the August 2 peak at $2,477. A breach of the latter will expose the all-time high at $2,483 ahead of $2,500.
Gold FAQs
Gold has played a key role in human’s history as it has been widely used as a store of value and medium of exchange. Currently, apart from its shine and usage for jewelry, the precious metal is widely seen as a safe-haven asset, meaning that it is considered a good investment during turbulent times. Gold is also widely seen as a hedge against inflation and against depreciating currencies as it doesn’t rely on any specific issuer or government.
Central banks are the biggest Gold holders. In their aim to support their currencies in turbulent times, central banks tend to diversify their reserves and buy Gold to improve the perceived strength of the economy and the currency. High Gold reserves can be a source of trust for a country’s solvency. Central banks added 1,136 tonnes of Gold worth around $70 billion to their reserves in 2022, according to data from the World Gold Council. This is the highest yearly purchase since records began. Central banks from emerging economies such as China, India and Turkey are quickly increasing their Gold reserves.
Gold has an inverse correlation with the US Dollar and US Treasuries, which are both major reserve and safe-haven assets. When the Dollar depreciates, Gold tends to rise, enabling investors and central banks to diversify their assets in turbulent times. Gold is also inversely correlated with risk assets. A rally in the stock market tends to weaken Gold price, while sell-offs in riskier markets tend to favor the precious metal.
The price can move due to a wide range of factors. Geopolitical instability or fears of a deep recession can quickly make Gold price escalate due to its safe-haven status. As a yield-less asset, Gold tends to rise with lower interest rates, while higher cost of money usually weighs down on the yellow metal. Still, most moves depend on how the US Dollar (USD) behaves as the asset is priced in dollars (XAU/USD). A strong Dollar tends to keep the price of Gold controlled, whereas a weaker Dollar is likely to push Gold prices up.
Author

Christian Borjon Valencia
FXStreet
Markets analyst, news editor, and trading instructor with over 14 years of experience across FX, commodities, US equity indices, and global macro markets.


