Gold prices defies strong US Dollar, surges on haven demand
- Gold prices advance for the fourth day, surpassing the 50-day SMA of $2,660 amid global unrest.
- Market reacts to reports of a potential ICBM launch by Russia.
- US economic data hints at a strong jobs market.
- Investors adjust expectations for the Fed's December meeting with a decreased likelihood of a rate cut to 56%.

Gold price extended its gains for the fourth consecutive day, clearing on its way to the 50-day Simple Moving Average (SMA) as the escalation of the Russia-Ukraine conflict augments demand for the safe-haven metal. The XAU/USD trades at $2,672 at around weekly highs, gaining over 0.80%.
Fears that Russia launched an Inter-Continental Ballistic Missile (ICBM) on Ukraine heightened tensions in Eastern Europe. However, according to Reuters citing a Western official, they did not use an ICBM on Thursday.
Consequently, the golden metal rose above the 50-day SMA, which is at $2,660, amid firm US Treasury yields and a bid US Dollar.
On the data front, last week's US Initial Jobless Claims hinted that the labor market remains strong, suggesting the Federal Reserve (Fed) could achieve a soft landing. Other data was not encouraging, like the Philadelphia Fed Manufacturing Index, which plunged to -5.5 in November, beneath October’s 10.3 reading.
Aside from this, Fed speakers crossed the wires. The New York Fed’s John Williams commented that the disinflationary process continues and added that the fed funds rate will be lower by the end of 2025.
Chicago’s Fed Chairman Austan Goolsbee echoed some of his comments. He repeated what he has said lately, supporting lower interest rates, but he opened the door to slowing the pace of easing policy.
Traders trimmed the chances for a 25 bps rate cut at the December meeting. The CME FedWatch Tool sees a 56% probability of lowering rates, down from a 58% chance two days ago.
Ahead this week, the economic docket will feature Fed speakers and the University of Michigan (UoM) Consumer Sentiment data in the US.
Daily digest market movers: Gold reaches a new weekly high amid escalation of Russia-Ukraine conflict
- Gold prices recovered even though US real yields climbed two basis points to 2.084%.
- US Treasury bond yields are rising, with the 10-year benchmark rate up two basis points to 4.434%.
- The US Dollar Index (DXY), which tracks the buck's performance against six currencies, gains over 0.34%, up at 107.00 near weekly highs.
- US Initial Jobless Claims fell to 213K for the week ending November 16, down from 217K and below the forecast of 220K.
- US Existing Home Sales rose to 3.96 million, an increase from 3.854 million, reflecting a 3.4% growth rate.
- Data from the Chicago Board of Trade, via the December fed funds rate futures contract, shows investors estimate 22 bps of Fed easing by the end of 2024.
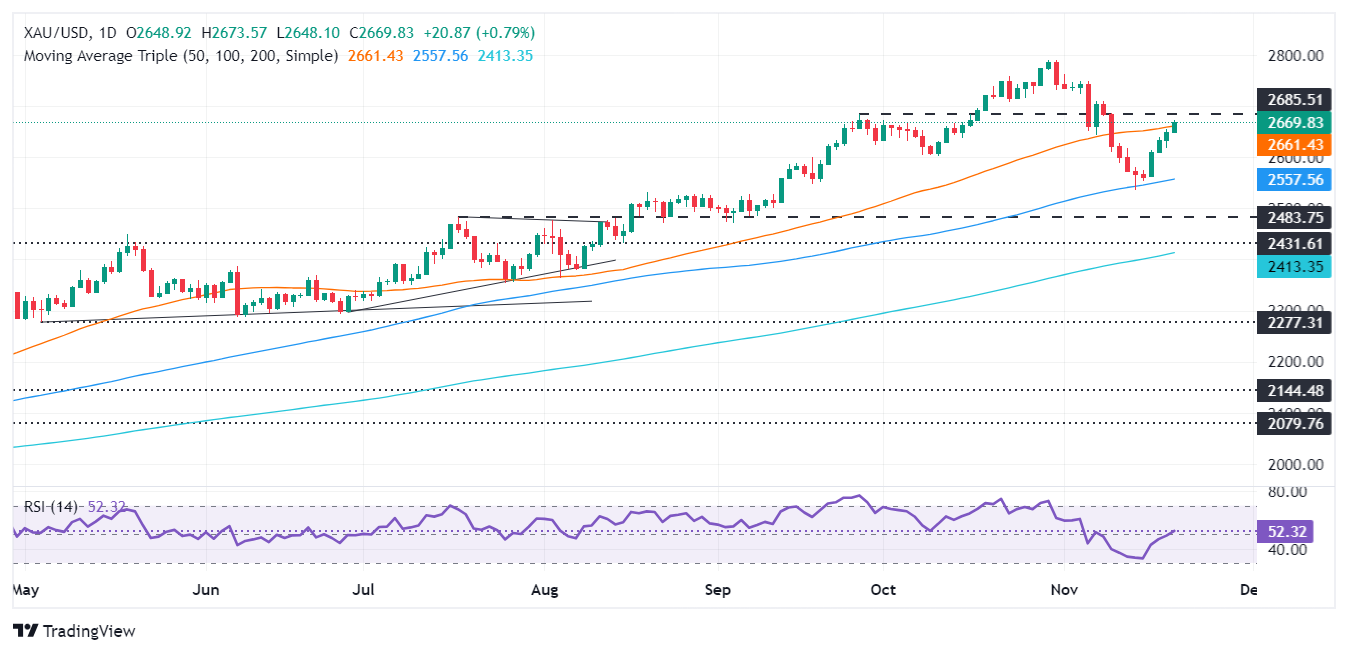
Technical outlook: Gold price clears the 50-day SMA
The uptrend in Gold prices is set to continue, with the non-yielding metal set to trade within the $2,660-$2,700 range. A breach of the latter will expose the November 7 high of $2,710, followed by the psychological $2,750 figure. Once those two levels are removed, up next lies the all-time peak at $2,790.
Conversely, sellers will have the upper hand if the non-yielding metal drops below the 50-day SMA at $2,658. Once surpassed, up next would be $2,600, followed by the 100-day Simple Moving Average (SMA) at $2,550. Bears could target the November 14 swing low of $2,536, followed by XAU/USD diving to $2,500.
The Relative Strength Index (RSI) has shifted to a bullish bias, indicating buyers are in charge.
Gold FAQs
Gold has played a key role in human’s history as it has been widely used as a store of value and medium of exchange. Currently, apart from its shine and usage for jewelry, the precious metal is widely seen as a safe-haven asset, meaning that it is considered a good investment during turbulent times. Gold is also widely seen as a hedge against inflation and against depreciating currencies as it doesn’t rely on any specific issuer or government.
Central banks are the biggest Gold holders. In their aim to support their currencies in turbulent times, central banks tend to diversify their reserves and buy Gold to improve the perceived strength of the economy and the currency. High Gold reserves can be a source of trust for a country’s solvency. Central banks added 1,136 tonnes of Gold worth around $70 billion to their reserves in 2022, according to data from the World Gold Council. This is the highest yearly purchase since records began. Central banks from emerging economies such as China, India and Turkey are quickly increasing their Gold reserves.
Gold has an inverse correlation with the US Dollar and US Treasuries, which are both major reserve and safe-haven assets. When the Dollar depreciates, Gold tends to rise, enabling investors and central banks to diversify their assets in turbulent times. Gold is also inversely correlated with risk assets. A rally in the stock market tends to weaken Gold price, while sell-offs in riskier markets tend to favor the precious metal.
The price can move due to a wide range of factors. Geopolitical instability or fears of a deep recession can quickly make Gold price escalate due to its safe-haven status. As a yield-less asset, Gold tends to rise with lower interest rates, while higher cost of money usually weighs down on the yellow metal. Still, most moves depend on how the US Dollar (USD) behaves as the asset is priced in dollars (XAU/USD). A strong Dollar tends to keep the price of Gold controlled, whereas a weaker Dollar is likely to push Gold prices up.
Author

Christian Borjon Valencia
FXStreet
Markets analyst, news editor, and trading instructor with over 14 years of experience across FX, commodities, US equity indices, and global macro markets.


