Gold Price Analysis: XAU/USD targets $1672 support after Powell’s blow – Confluence Detector

Gold (XAU/USD) is on its way to test the June 2020 low at $1671, as the bears remain in control after Fed Chair Jerome Powell downplayed the recent turmoil in the bond market. Powell said that the recent bond market jitter "caught my attention", which disappointed markets and triggered a renewed uptick in the US dollar alongside the Treasury yields. Gold and stocks suffered thereafter.
Further, with the US $1.9 trillion stimulus just a step away from the Senate approval, Treasury yields could continue with its surge, exacerbating the pain in the non-yielding gold. The next key event risk for gold is the US NFP release, which could set the tone for markets in the week ahead.
Let’s take a look at the technical charts for gold’s key levels.
Gold Price Chart: Key resistance and support levels
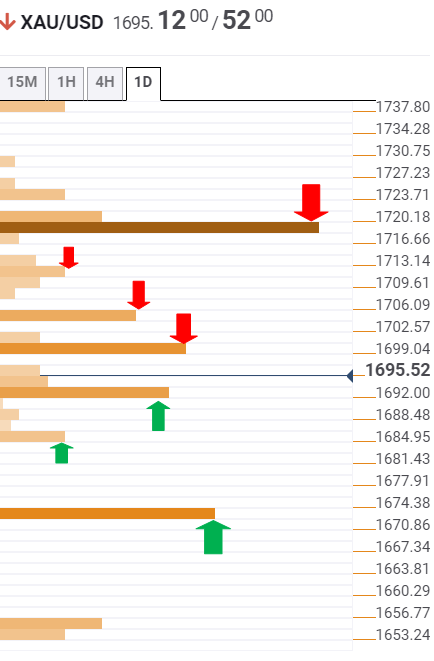
The Technical Confluences Detector shows that gold’s path of least resistance is to the downside, with the immediate cushion aligned at $1691, the confluence of the previous day low and pivot point one-week S1.
The bulls would then look to minor support at $1683 for some temporary reprieve. That level is the pivot point one-day S1.
A sustained break below the latter could trigger a sharp drop towards the powerful support at $1672, which is the convergence of the pivot point one-day S2 and pivot point one-month S1.
Meanwhile, any recovery attempt could meet strong demand around $1700, where the Fibonacci 23.6% one-day, SMA10 one-hour and Bollinger Band one-day Lower coincide.
The next relevant hurdle is seen at $1704, the Fibonacci 38.2% one-day.
The buyers would then challenge the Fibonacci 61.8% one-day at $1711 on its way towards $1717, the intersection of the previous month and week low.
Here is how it looks on the tool
About Technical Confluences Detector
The TCD (Technical Confluences Detector) is a tool to locate and point out those price levels where there is a congestion of indicators, moving averages, Fibonacci levels, Pivot Points, etc. Knowing where these congestion points are located is very useful for the trader, and can be used as a basis for different strategies.
Author

Dhwani Mehta
FXStreet
Residing in Mumbai (India), Dhwani is a Senior Analyst and Manager of the Asian session at FXStreet. She has over 10 years of experience in analyzing and covering the global financial markets, with specialization in Forex and commodities markets.


