Gold Price Analysis: XAU/USD pares gains after touching new multi-month high of $1,912
- Gold price holds gains above $1900, four-month highs.
- Rising inflation concerns, dovish Fed continue to pressure DXY, yields.
- Gold Price Forecast: XAU/USD breaks through $1900, room for additional upside?

Update May 26: The sharp decline witnessed in the US Treasury bond yields provided a boost to gold on Tuesday and the XAU/USD pair gained 1%. With XAU/USD breaking above the $1,900 psychological level on Wednesday, a technical buying wave got triggered and the pair touched its highest level since early January at $1,812. However, profit-taking in the late European session seems to be making it difficult for gold to continue to push higher. As of writing, XAU/USD was posting small daily gains at $1,902. Despite the pullback, a daily close above $1,900 could be seen as a buying opportunity by investors.
In the absence of any major market-moving economic releases from the US, investors will take cues from a scheduled speech from the Fed Vice Chair Randal Quarles. Any relevant comments surrounding inflation, potential tapering and the Fed's monetary policy outlook should infuse some volatility around gold prices.
Looking ahead, all eyes remain on the Fedspeak, as the US data calendar remains light. Attention also turns towards the US Preliminary GDP, Consumer Durable Goods data and Fed’s preferred inflation gauge for fresh directives.
Watch: Gold price surges past $1,900 – Is $2,000 the next stop? [Video]
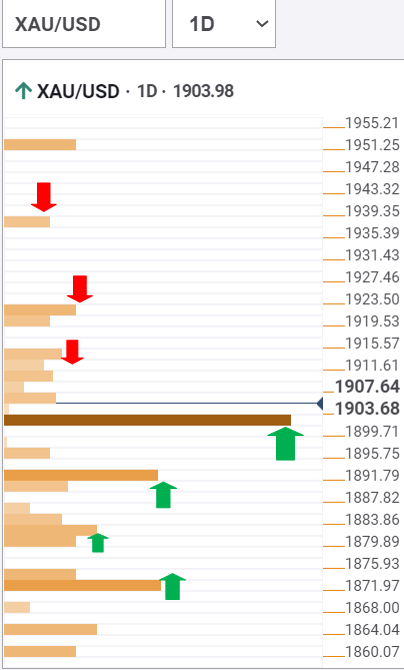
Gold Price: Key levels to watch
The Technical Confluences Detector shows that gold price has taken out a powerful resistance at $1900, which is the convergence of the previous day high, pivot point one-week R1 and pivot point one-month R3.
The next target for gold bulls is aligned around $1913, where the Bollinger Band one-day Upper meets the pivot point one-day R1.
The pivot point one-week R2 at $1920 will test the bullish commitments going forward.
A sustained move above the latter could trigger a fresh upswing towards $1937, the pivot point one-day R3.
Meanwhile, if the abovementioned resistance now support at $1900 gives way, a drop towards the previous week high and SMA10 four-hour at $1890 cannot be ruled out.
Gold sellers could then challenge the $1880 demand area, the intersection of the pivot point one-day S1 and SMA5 one-day.
The last line of defense for bulls is seen at $1870, where the Fibonacci 38.2% one-week coincides with the SMA200 one-hour.
Here is how it looks on the tool
About Technical Confluences Detector
The TCD (Technical Confluences Detector) is a tool to locate and point out those price levels where there is a congestion of indicators, moving averages, Fibonacci levels, Pivot Points, etc. If you are a short-term trader, you will find entry points for counter-trend strategies and hunt a few points at a time. If you are a medium-to-long-term trader, this tool will allow you to know in advance the price levels where a medium-to-long-term trend may stop and rest, where to unwind positions, or where to increase your position size.
Previous updates
Update: Gold built on the previous day's strong positive move and gained some follow-through traction for the second consecutive session on Wednesday. Investors now seem convinced that the Fed will retain its ultra-lose monetary policy stance. This was evident from the recent leg down in the US Treasury bond yields, which, in turn, was seen as a key factor that continued benefitting the non-yielding yellow metal. Apart from this, some technical buying above the $1,900 round-figure mark lifted spot prices to the highest level since January 8.
However, a combination of factors might hold bullish traders from placing fresh bets and keep a lid on any further gains for the XAU/USD. The prevalent risk-on environment – as depicted by a generally positive tone around the global equity markets – acted as a headwind for traditional safe-haven assets, including gold. This, along with a modest US dollar rebound from multi-month tops, might further collaborate to cap gains for the dollar-denominated commodity amid overbought RSI on the daily chart.
Update: Gold price entered a bullish consolidation phase after refreshing four-month highs above $1900 this Wednesday. Broad-based rebound in the US dollar appears to cap the additional upside in gold. The greenback recovers from the weaker US data and Fed’s dovish stance-led sell-off. Despite a minor retreat, the bullish undertone in gold price remains intact amid growing inflation concerns, as the Fed continues to dismiss rising price pressures. Further, renewed weakness in the Treasury yields combined with mixed tone in the global stocks continues to support gold price.
Author

Dhwani Mehta
FXStreet
Residing in Mumbai (India), Dhwani is a Senior Analyst and Manager of the Asian session at FXStreet. She has over 10 years of experience in analyzing and covering the global financial markets, with specialization in Forex and commodities markets.


