Gold Price Analysis: XAU/USD needs to crack $1800 to extend post-Fed gains – Confluence Detector


Gold (XAU/USD) is consolidating near four-day highs but remains below $1800 so far this Thursday. Fed Chair Jerome Powell’s dismissal of tapering bets gave the much-needed boost to the XAU bulls. Meanwhile, US President Joe Biden pushed for his $1.8 trillion stimulus package, which exerted additional upside pressure on gold.

The US Treasury yields fell across the curve amid expectations of prolonged policy support from both the government and the central bank, supporting the non-yielding gold. Let’s how gold’s technical graphs are aligned ahead of key US economic data.

Gold Price Chart: Key resistance and support levels

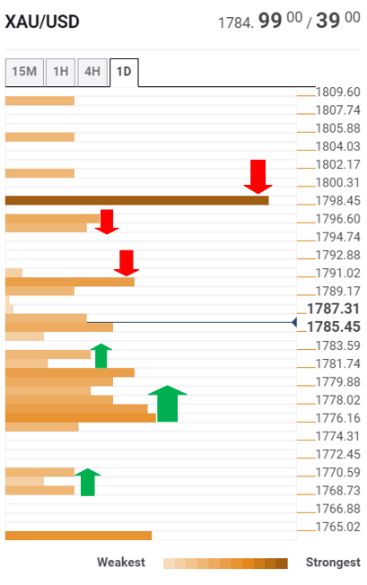
The Technical Confluences Detector shows that gold’s path of least resistance appears to the upside, as a dense cluster of healthy support levels is lined up around $1780-$1775.

The zone is the confluence of the SMA50 four-hour, Fibonacci 61.8% one-week, Fibonacci 23.6% one-day and SMA10 one-day.

Ahead of this cushion, the XAU bears could test the immediate support at $1783, the Fibonacci 38.2% one-week.

Further south, the Fibonacci 61.8% one-day at $1770 could be the next target for the sellers.

However, if the bullish momentum resumes, the XAU bulls could likely take on the $1791 barrier, which is the convergence of the Fibonacci 23.6% one-week and the pivot point one-day R1.

The next stoppage is seen at the intersection of the pivot point one-day R2 and pivot point one-week R1 at $1796.

The next key level for gold traders is the $1800 mark that needs to be scaled on a sustained basis to extend the Fed-led upside.

Around that point, the previous week high coincides with the pivot one-month R2.

Here is how it looks on the tool       

fxsoriginal

About Technical Confluences Detector

The TCD (Technical Confluences Detector) is a tool to locate and point out those price levels where there is a congestion of indicators, moving averages, Fibonacci levels, Pivot Points, etc. Knowing where these congestion points are located is very useful for the trader, and can be used as a basis for different strategies.


Share: Feed news

Information on these pages contains forward-looking statements that involve risks and uncertainties. Markets and instruments profiled on this page are for informational purposes only and should not in any way come across as a recommendation to buy or sell in these assets. You should do your own thorough research before making any investment decisions. FXStreet does not in any way guarantee that this information is free from mistakes, errors, or material misstatements. It also does not guarantee that this information is of a timely nature. Investing in Open Markets involves a great deal of risk, including the loss of all or a portion of your investment, as well as emotional distress. All risks, losses and costs associated with investing, including total loss of principal, are your responsibility. The views and opinions expressed in this article are those of the authors and do not necessarily reflect the official policy or position of FXStreet nor its advertisers. The author will not be held responsible for information that is found at the end of links posted on this page.

If not otherwise explicitly mentioned in the body of the article, at the time of writing, the author has no position in any stock mentioned in this article and no business relationship with any company mentioned. The author has not received compensation for writing this article, other than from FXStreet.

FXStreet and the author do not provide personalized recommendations. The author makes no representations as to the accuracy, completeness, or suitability of this information. FXStreet and the author will not be liable for any errors, omissions or any losses, injuries or damages arising from this information and its display or use. Errors and omissions excepted.

The author and FXStreet are not registered investment advisors and nothing in this article is intended to be investment advice.

Recommended content


Recommended content

Editors’ Picks

EUR/USD edges lower toward 1.0700 post-US PCE

EUR/USD edges lower toward 1.0700 post-US PCE

EUR/USD stays under modest bearish pressure but manages to hold above 1.0700 in the American session on Friday. The US Dollar (USD) gathers strength against its rivals after the stronger-than-forecast PCE inflation data, not allowing the pair to gain traction.

EUR/USD News

GBP/USD retreats to 1.2500 on renewed USD strength

GBP/USD retreats to 1.2500 on renewed USD strength

GBP/USD lost its traction and turned negative on the day near 1.2500. Following the stronger-than-expected PCE inflation readings from the US, the USD stays resilient and makes it difficult for the pair to gather recovery momentum.

GBP/USD News

Gold struggles to hold above $2,350 following US inflation

Gold struggles to hold above $2,350 following US inflation

Gold turned south and declined toward $2,340, erasing a large portion of its daily gains, as the USD benefited from PCE inflation data. The benchmark 10-year US yield, however, stays in negative territory and helps XAU/USD limit its losses. 

Gold News

Bitcoin Weekly Forecast: BTC’s next breakout could propel it to $80,000 Premium

Bitcoin Weekly Forecast: BTC’s next breakout could propel it to $80,000

Bitcoin’s recent price consolidation could be nearing its end as technical indicators and on-chain metrics suggest a potential upward breakout. However, this move would not be straightforward and could punish impatient investors. 

Read more

Week ahead – Hawkish risk as Fed and NFP on tap, Eurozone data eyed too

Week ahead – Hawkish risk as Fed and NFP on tap, Eurozone data eyed too

Fed meets on Wednesday as US inflation stays elevated. Will Friday’s jobs report bring relief or more angst for the markets? Eurozone flash GDP and CPI numbers in focus for the Euro.

Read more

Forex MAJORS

Cryptocurrencies

Signatures