Gold Price Analysis: XAU/USD eyes key $1922 upside level amid US election chaos – Confluence Detector


Gold (XAU/USD) is looking for a clear direction while holding above $1900. The metal witnessed wild swings in choppy trading on Wednesday, in light of the chaotic and long US election. As it stands, Democrat Joe Biden is closer towards the US Presidency following a tighter race but the Trump campaign has filed a legal battle to contest the elections. 

Meanwhile, prospects of Republicans taking over the Senate point towards a continued stimulus deadlock on a Biden win and keep markets unnerved. The risk-off flows amid election and policy uncertainty will likely keep a floor under gold prices, as attention turns towards the FOMC decision and US NFP report.

How is gold positioned technically?

Gold: Key resistances and supports

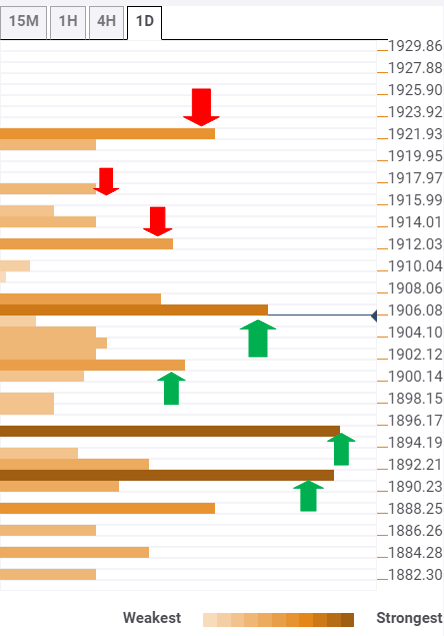
The Technical Confluences Indicator shows that the yellow metal is holding firmer so far this session, looking to test immediate resistance at $1912, the confluence of the previous week high and Bollinger Band one-hour Upper.

Further up, a dense cluster of resistance is seen around $1916, which is the intersection of the previous day high and SMA50 one-day.

Acceptance above the latter could open doors towards the next relevant barrier at $1922, where the pivot point one-month R1 is located.

Alternatively, a breach of the major support at $1906, the convergence of the Fibonacci 61.8% one-month and previous high on four-hour, could prompt the sellers to regain control.

The next downside target is aligned at $1901, the SMA5 on four-hour. A failure to defend the last would expose the powerful support at $1895, which is the meeting point of the Fibonacci 38.2% one-day, SMA100 one-day and SMA10 one-day.

Bears need a sustained break below the critical cushion at $1891 to unleashing further losses. That level is the confluence of the SMA100 one-hour and SMA5 one-day.

Here is how it looks on the tool

fxsoriginal

About Confluence Detector

The Confluence Detector finds exciting opportunities using Technical Confluences. The TC is a tool to locate and point out those price levels where there is a congestion of indicators, moving averages, Fibonacci levels, Pivot Points, etc. Knowing where these congestion points are located is very useful for the trader, and can be used as a basis for different strategies.

Learn more about Technical Confluence

Share: Feed news

Information on these pages contains forward-looking statements that involve risks and uncertainties. Markets and instruments profiled on this page are for informational purposes only and should not in any way come across as a recommendation to buy or sell in these assets. You should do your own thorough research before making any investment decisions. FXStreet does not in any way guarantee that this information is free from mistakes, errors, or material misstatements. It also does not guarantee that this information is of a timely nature. Investing in Open Markets involves a great deal of risk, including the loss of all or a portion of your investment, as well as emotional distress. All risks, losses and costs associated with investing, including total loss of principal, are your responsibility. The views and opinions expressed in this article are those of the authors and do not necessarily reflect the official policy or position of FXStreet nor its advertisers. The author will not be held responsible for information that is found at the end of links posted on this page.

If not otherwise explicitly mentioned in the body of the article, at the time of writing, the author has no position in any stock mentioned in this article and no business relationship with any company mentioned. The author has not received compensation for writing this article, other than from FXStreet.

FXStreet and the author do not provide personalized recommendations. The author makes no representations as to the accuracy, completeness, or suitability of this information. FXStreet and the author will not be liable for any errors, omissions or any losses, injuries or damages arising from this information and its display or use. Errors and omissions excepted.

The author and FXStreet are not registered investment advisors and nothing in this article is intended to be investment advice.

Recommended content


Recommended content

Editors’ Picks

EUR/USD holds above 1.0700 ahead of key US data

EUR/USD holds above 1.0700 ahead of key US data

EUR/USD trades in a tight range above 1.0700 in the early European session on Friday. The US Dollar struggles to gather strength ahead of key PCE Price Index data, the Fed's preferred gauge of inflation, and helps the pair hold its ground. 

EUR/USD News

USD/JPY stays above 156.00 after BoJ Governor Ueda's comments

USD/JPY stays above 156.00 after BoJ Governor Ueda's comments

USD/JPY holds above 156.00 after surging above this level with the initial reaction to the Bank of Japan's decision to leave the policy settings unchanged. BoJ Governor said weak Yen was not impacting prices but added that they will watch FX developments closely.

USD/JPY News

Gold price oscillates in a range as the focus remains glued to the US PCE Price Index

Gold price oscillates in a range as the focus remains glued to the US PCE Price Index

Gold price struggles to attract any meaningful buyers amid the emergence of fresh USD buying. Bets that the Fed will keep rates higher for longer amid sticky inflation help revive the USD demand.

Gold News

Sei Price Prediction: SEI is in the zone of interest after a 10% leap

Sei Price Prediction: SEI is in the zone of interest after a 10% leap

Sei price has been in recovery mode for almost ten days now, following a fall of almost 65% beginning in mid-March. While the SEI bulls continue to show strength, the uptrend could prove premature as massive bearish sentiment hovers above the altcoin’s price.

Read more

US core PCE inflation set to signal firm price pressures as markets delay Federal Reserve rate cut bets

US core PCE inflation set to signal firm price pressures as markets delay Federal Reserve rate cut bets

The core PCE Price Index, which excludes volatile food and energy prices, is seen as the more influential measure of inflation in terms of Fed positioning. The index is forecast to rise 0.3% on a monthly basis in March, matching February’s increase. 

Read more

Forex MAJORS

Cryptocurrencies

Signatures