Gold Price Analysis: XAU/USD bulls looking to build on momentum beyond $1,900 mark
- Gold price posts small losses, as King dollar dominates amid risk-off mood.
- Investors remain cautious ahead of the critical US inflation report.
- Gold Weekly Forecast: XAU/USD snaps four-week winning streak, closes below $1,900.

Update: Gold reversed an intraday dip to the $1,890 area and inched back closer to session tops, albeit lacked any follow-through buying. Friday's softer US NFP prints tempered market expectations for an earlier than anticipated lift-off. This, along with the ongoing decline in the US Treasury bond yields, continued acting as a tailwind for the non-yielding yellow metal. Apart from this, a generally cautious mood around the equity markets was seen as another factor that benefitted traditional safe-haven assets, including gold.
That said, bulls, so far, have been struggling to capitalize on the move or find acceptance above the $1,900 round-figure mark. Investors remain concerned that rising inflationary pressure might force the Fed to start the discussion on tapering its asset purchases. This, in turn, forced investors to lighten their bearish bets surrounding the US dollar and capped gains for the dollar-denominated gold. This makes it prudent to wait for some strong follow-through buying beyond the monthly swing highs, around the $1,915-16 region before positioning for any further appreciating move.
Previous update: Gold price is trading under pressure below $1900, although remains confined within a familiar range. Sellers returned after gold price failed to find acceptance above the latter yet again. The retreat in gold could be largely associated with a broad-based rebound staged by the US dollar amid the cautious market mood. Investors prefer the safe-haven US dollar amid inflation anxiety and uncertainty on the Fed’s monetary policy stance.
Additionally, renewed US-China concerns and covid woes in Asia lift the safe-haven appeal of the dollar at gold’s expense. However, the downside in gold price appears limited amid risk-off sentiment-led weakness in the US Treasury yields across the curve. Gold traders eagerly await the US inflation data due this Thursday for fresh direction, as the data could throw fresh light on the Fed’s next policy move.
Read: Gold Price Forecast: Acceptance above $1900 is critical for XAU/USD, focus shifts to US CPI
Gold Price: Key levels to watch
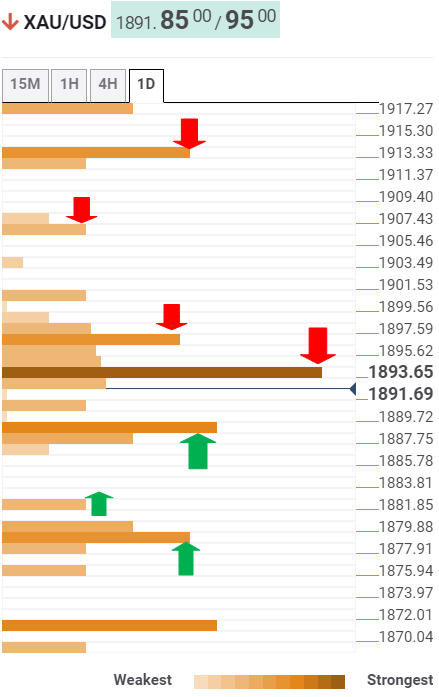
The Technical Confluences Detector shows that gold price is struggling below a powerful resistance around $1894, as it attempts a bounce from lower levels.
That hurdle is the confluence of the Fibonacci 38.2% one-day, Fibonacci 61.8% one-week and SMA5 one-day.
Further up, the intersection of the Fibonacci 23.6% one-day, SMA5 four-hour and SMA10 one-day at $1897 could probe the bullish traders.
The next upside target awaits at the previous day high of $1900, above which the pivot point one-day R1 could get tested.
Gold price would then keep an eye on the previous month high of $1913.
Alternatively, if the convergence of the Fibonacci 61.8% one-day and SMA100 four-hour at $1887 caves in, the sellers could aim for the previous day low of $1881.
The next safety net for the buyers is seen around $1879-$1877, where the Fibonacci 23.6% one-month, Fibonacci 38.2% one-week and Bollinger Band one-day Middle coincide.
Here is how it looks on the tool
About Technical Confluences Detector
The TCD (Technical Confluences Detector) is a tool to locate and point out those price levels where there is a congestion of indicators, moving averages, Fibonacci levels, Pivot Points, etc. If you are a short-term trader, you will find entry points for counter-trend strategies and hunt a few points at a time. If you are a medium-to-long-term trader, this tool will allow you to know in advance the price levels where a medium-to-long-term trend may stop and rest, where to unwind positions, or where to increase your position size.
Author

Dhwani Mehta
FXStreet
Residing in Mumbai (India), Dhwani is a Senior Analyst and Manager of the Asian session at FXStreet. She has over 10 years of experience in analyzing and covering the global financial markets, with specialization in Forex and commodities markets.


