Gold Price Analysis: XAU/USD extends daily rebound toward $1,900
- XAU/USD gained traction after edging lower earlier in the day.
- Ongoing USD weakness seems to be allowing gold to push higher.
- A daily close above $1,900 could open the door for additional gains.

Following Thursday's steep decline, the XAU/USD pair staged a decisive rebound on Friday but ended up snapping a four-week winning streak. With the greenback struggling to find demand at the start of the week, gold continues to edge higher and was last seen gaining 0.25% on the day at $1,895.
On Friday, the data published by the US Bureau of Labor Statistics revealed that Nonfarm Payrolls in May rose by 559,000. This reading missed the market expectation of 650,000 and revived hopes of the Fed not rushing into tapering talks, triggering a sharp decline in the US Treasury bond yields and broad-based USD weakness. The benchmark 10-year US T-bond yield lost more than 4% and XAU/USD to erase a large portion of Thursday's losses.
Although the 10-year US T-bond yield started the new week on a firm footing after US Treasury Secretary Janet Yellen said over the weekend that an increase in inflation and interest rates would signal a positive development. Reflecting the positive impact of recovery yields on the greenback, the US Dollar Index (DXY) climbed to a daily high of 90.30.
Nevertheless, the USD struggled to preserve its bullish momentum with the T-bond yields retracing the bullish opening gap and XAU/USD gained traction. In the absence of significant fundamental drivers, the USD's market valuation is likely to continue to drive XAU/USD's movements.
Gold Price Analysis: XAU/USD set to move lower in the near-term – OCBC.
In a recently published report, OCBC Bank analysts noted that total known gold ETF holdings increased by 1.58 million oz in May, marking the first positive inflow into this space in three months. "With breakeven yields staying stagnant, we continue to see gold as trading too rich and expect it to continue correcting this week," analysts added.
Gold technical outlook
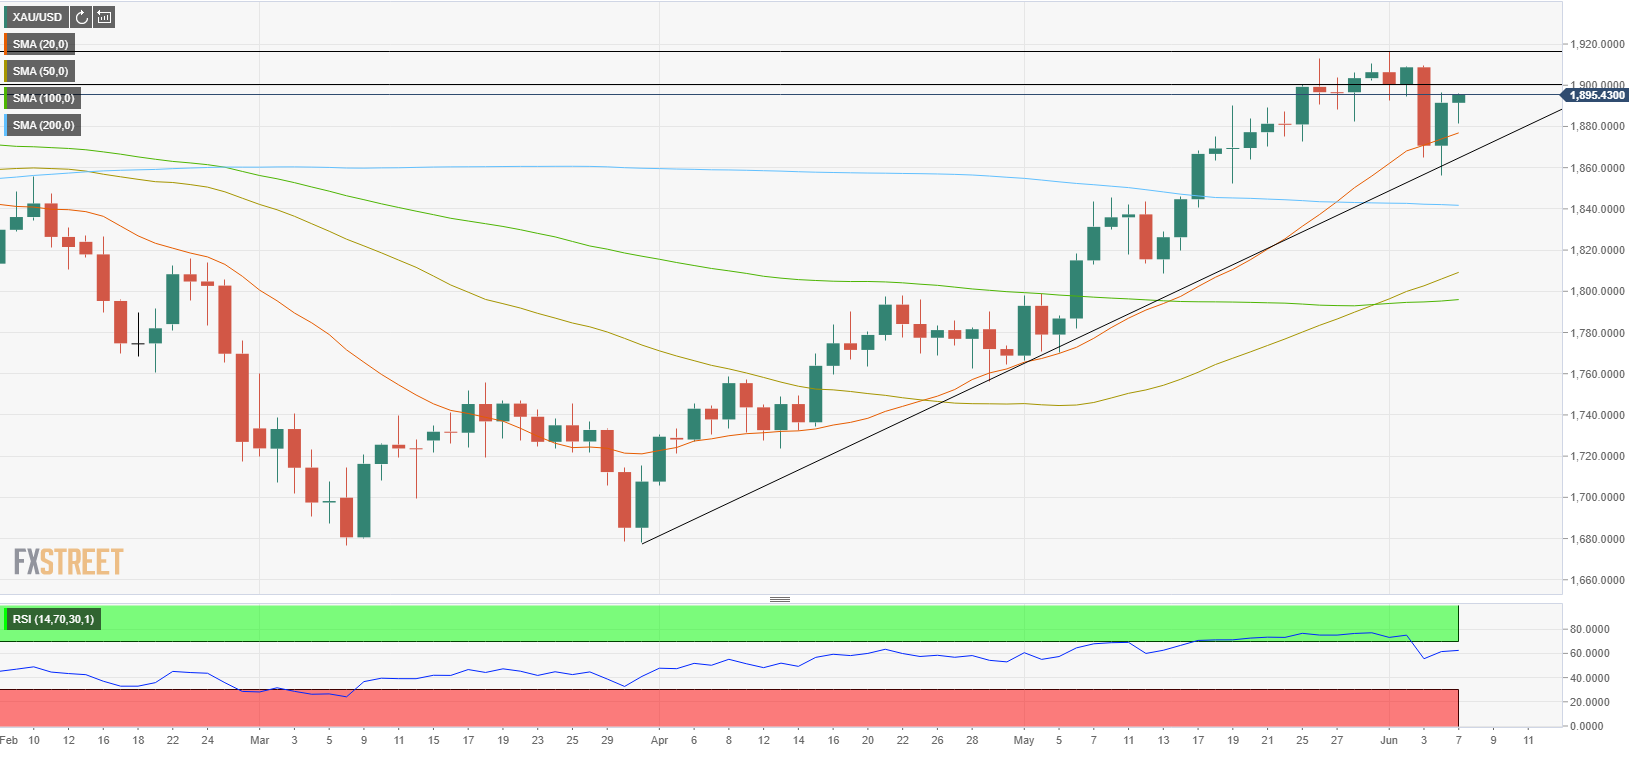
On the daily chart, the Relative Strength Index (RSI) indicator is holding above 60, suggesting that sellers are struggling to take control of gold's action. Furthermore, the ascending trend line coming from early April remains intact, confirming the view that the pair remains technically bullish.
On the upside, the initial resistance is located at $1,900 (psychological level). A daily close above that level could open the door for additional gains toward $1,916 (June 1 high).
On the other hand, the initial support is located at $1,876 (20-day SMA) ahead of $1,865 (ascending trend line). If sellers manage to drag the price below the latter, the next significant support is located at $1,840 (200-day SMA).
Additional levels to watch for
Author

Eren Sengezer
FXStreet
As an economist at heart, Eren Sengezer specializes in the assessment of the short-term and long-term impacts of macroeconomic data, central bank policies and political developments on financial assets.


