|

Gold Price Analysis: Short-term support trendline, at $1,550, in focus

  • Gold fails to extend the early-day recovery.
  • Overbought RSI conditions, bullish exhaustion favor further declines.
  • 21-day SMA adds to the support whereas buyers will wait for the sustained break of 23.6% Fibonacci retracement.

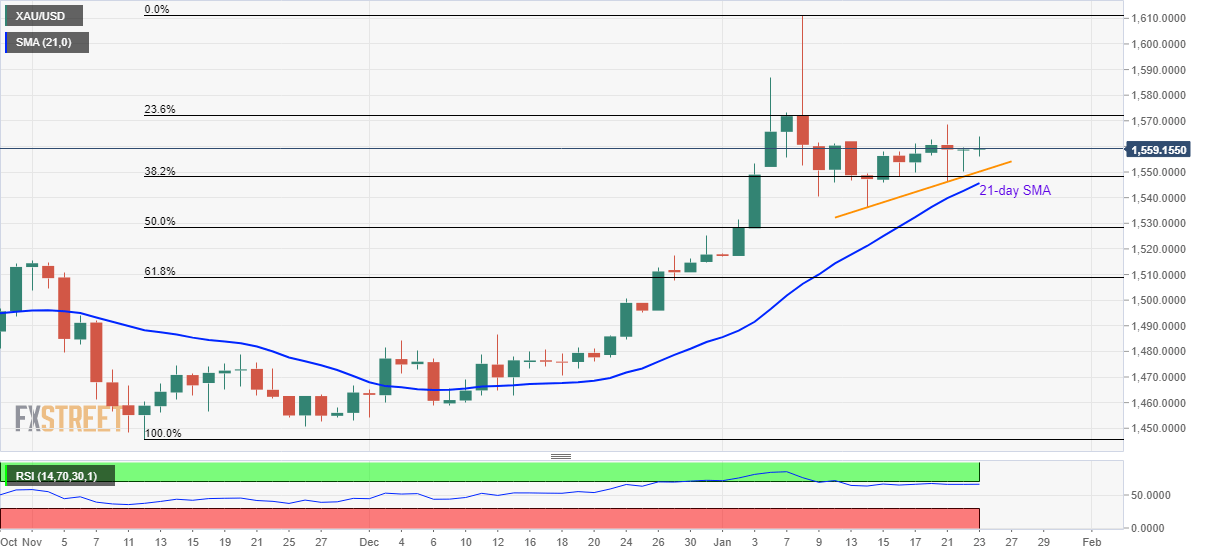
Gold prices turn mildly weak while flashing $1,558.80 as a quote during the early Thursday. The yellow metal’s failure to register much upside, despite being above near-term key supports amid overbought RSI conditions, increases the odds for the pullback.

With this, an upward sloping trend line since January 14, at $1,550 now, followed by a 21-day SMA level near $1,545 gain sellers’ attention.

If at all prices remain weak below $1,545, 50% Fibonacci retracement level of the metal’s rise from November 2019 to January 08, 2020, at $1,528, will lure the bears.

On the upside, the bullion needs to close beyond 23.6% Fibonacci retracement level of $1,572, on a daily basis, to revisit January 06 high near $1,587 and $1,600 round-figure.

During the quote’s sustained run-up beyond $1,600, the monthly top surrounding $1,611 holds the gate for further rise to March 2013 high near $1,620.

Gold daily chart
Trend: Pullback expected

Additional important levels

Overview
Today last price1558.46
Today Daily Change-0.32
Today Daily Change %-0.02%
Today daily open1558.78
 
Trends
Daily SMA201544.99
Daily SMA501500.78
Daily SMA1001497.64
Daily SMA2001441.49
 
Levels
Previous Daily High1559.75
Previous Daily Low1550.4
Previous Weekly High1562
Previous Weekly Low1536.35
Previous Monthly High1525.1
Previous Monthly Low1454.05
Daily Fibonacci 38.2%1556.18
Daily Fibonacci 61.8%1553.97
Daily Pivot Point S11552.87
Daily Pivot Point S21546.96
Daily Pivot Point S31543.52
Daily Pivot Point R11562.22
Daily Pivot Point R21565.66
Daily Pivot Point R31571.57

Author

Anil Panchal

Anil Panchal

FXStreet

Anil Panchal has nearly 15 years of experience in tracking financial markets. With a keen interest in macroeconomics, Anil aptly tracks global news/updates and stays well-informed about the global financial moves and their implications.


More from Anil Panchal
Share:

Editor's Picks

AUD/USD consolidates above 0.6950 amid risk aversion

AUD/USD consolidates in the Asian session on Thursday, trading just above 0.6950 as traders assess developments in the Middle East crisis. The Pentagon reportedly ordered readiness for potential strikes against Iran. This keeps the geopolitical risk premium in play, which, along with hawkish FOMC Minutes and elevated US bond yields, will likely keep the US Dollar underpinned at the expense of the pair.

USD/JPY slips below 158.00 as USD retreats

USD/JPY returns to the red below 158.00 in the Asian session on Thursday amid speculation that authorities will step in to prop up the Japanese Yen. Meanwhile, the US Dollar eases from near an 18-month high on profit taking, ignoring Wednesday's hawkish FOMC Minutes and the risk of a further escalation of tensions in the Middle East, adding to the pair's pullback.

Gold struggles as rising yields and hawkish Fed signals weigh

Gold reverses its modest recovery on Thursday as a stronger US Dollar and rising US Treasury yields cap upside attempts, leaving the metal in a bearish consolidation phase near two-month lows. At the time of writing, XAU/USD trades around $4,119, easing from an intraday high of $4,143.

Ripple and Stellar test key support amid rising downside risks
Ripple (XRP) and Stellar (XLM) remain under pressure and extend their corrections on Thursday as weakening derivatives metrics and broader macroeconomic headwinds weigh on sentiment. XRP and XLM approach a key support zone after three consecutive days of losses so far this week.
The UK 30-year gilt just hit a 1998 high. Is that good or bad for the British Pound?
The yield on the UK's 30-year government bond, or gilt, went through 6% on October 1 for the first time since early 1998, and on Monday the Pound was at its strongest against the Euro since June 2025. The gilt market's 28-year high is mostly someone else's. Since early May, the 30-year gilt yield has risen about 0.15 of a percentage point and the US 30-year about 0.7.
The UK 30-year gilt just hit a 1998 high. Is that good or bad for the British Pound?
The yield on the UK's 30-year government bond, or gilt, went through 6% on October 1 for the first time since early 1998, and on Monday the Pound was at its strongest against the Euro since June 2025. The gilt market's 28-year high is mostly someone else's. Since early May, the 30-year gilt yield has risen about 0.15 of a percentage point and the US 30-year about 0.7.














