Gold hits new record high above $2,550 after US PPI inflation data
- Gold rises to new record highs above $2,550 after the release of US “factory gate” price inflation.
- Risk sentiment is upbeat, however, curbing enthusiasm for the safe-haven.

Gold (XAU/USD) breaks out of its established range and posts new all-time-highs of $2.551 on Thursday after the release of US inflation data in the form of “factory gate” price inflation, or the Producer Price Index (PPI).
Gold pushes to new all-time-high following release of US factory gate inflation data
Gold spikes to a new record high and the US Dollar (USD) broadly weakens following the release of US PPI and Jobless Claims data on Thursday.
The US Producer Price Index (PPI) ex Food & Energy rose by 2.4% in August, the same as the 2.4% registered in July. The result came in below expectations of 2.5%, according to data from the US Bureau of Labor Statistics (BLS).
On the month, core PPI rose 0.3% compared to the downwardly-revised 0.2% decline in July. Economists had expected a 0.2% rise.
Headline PPI, meanwhile, rose 1.7% in August after a revised-down 2.1% rise in the previous month. The result was below expectations of 1.8%. On a monthly basis PPI rose 0.2%, which compared to the downwardly revised 0.0% registered in July and was above the 0.1% expected.
US jobs data released at the same time showed Initial Jobless Claims rose 230K in the week ending September 6, coming in above the revised-up 228K of the previous week and was in line with the 230K forecast.
Continuing Jobless Claims rose 1.850M, which was higher than the previous week’s revised-up 1.845M, according to the US Department of Labor.
Technical Analysis: Gold breaks to new all-time-highs
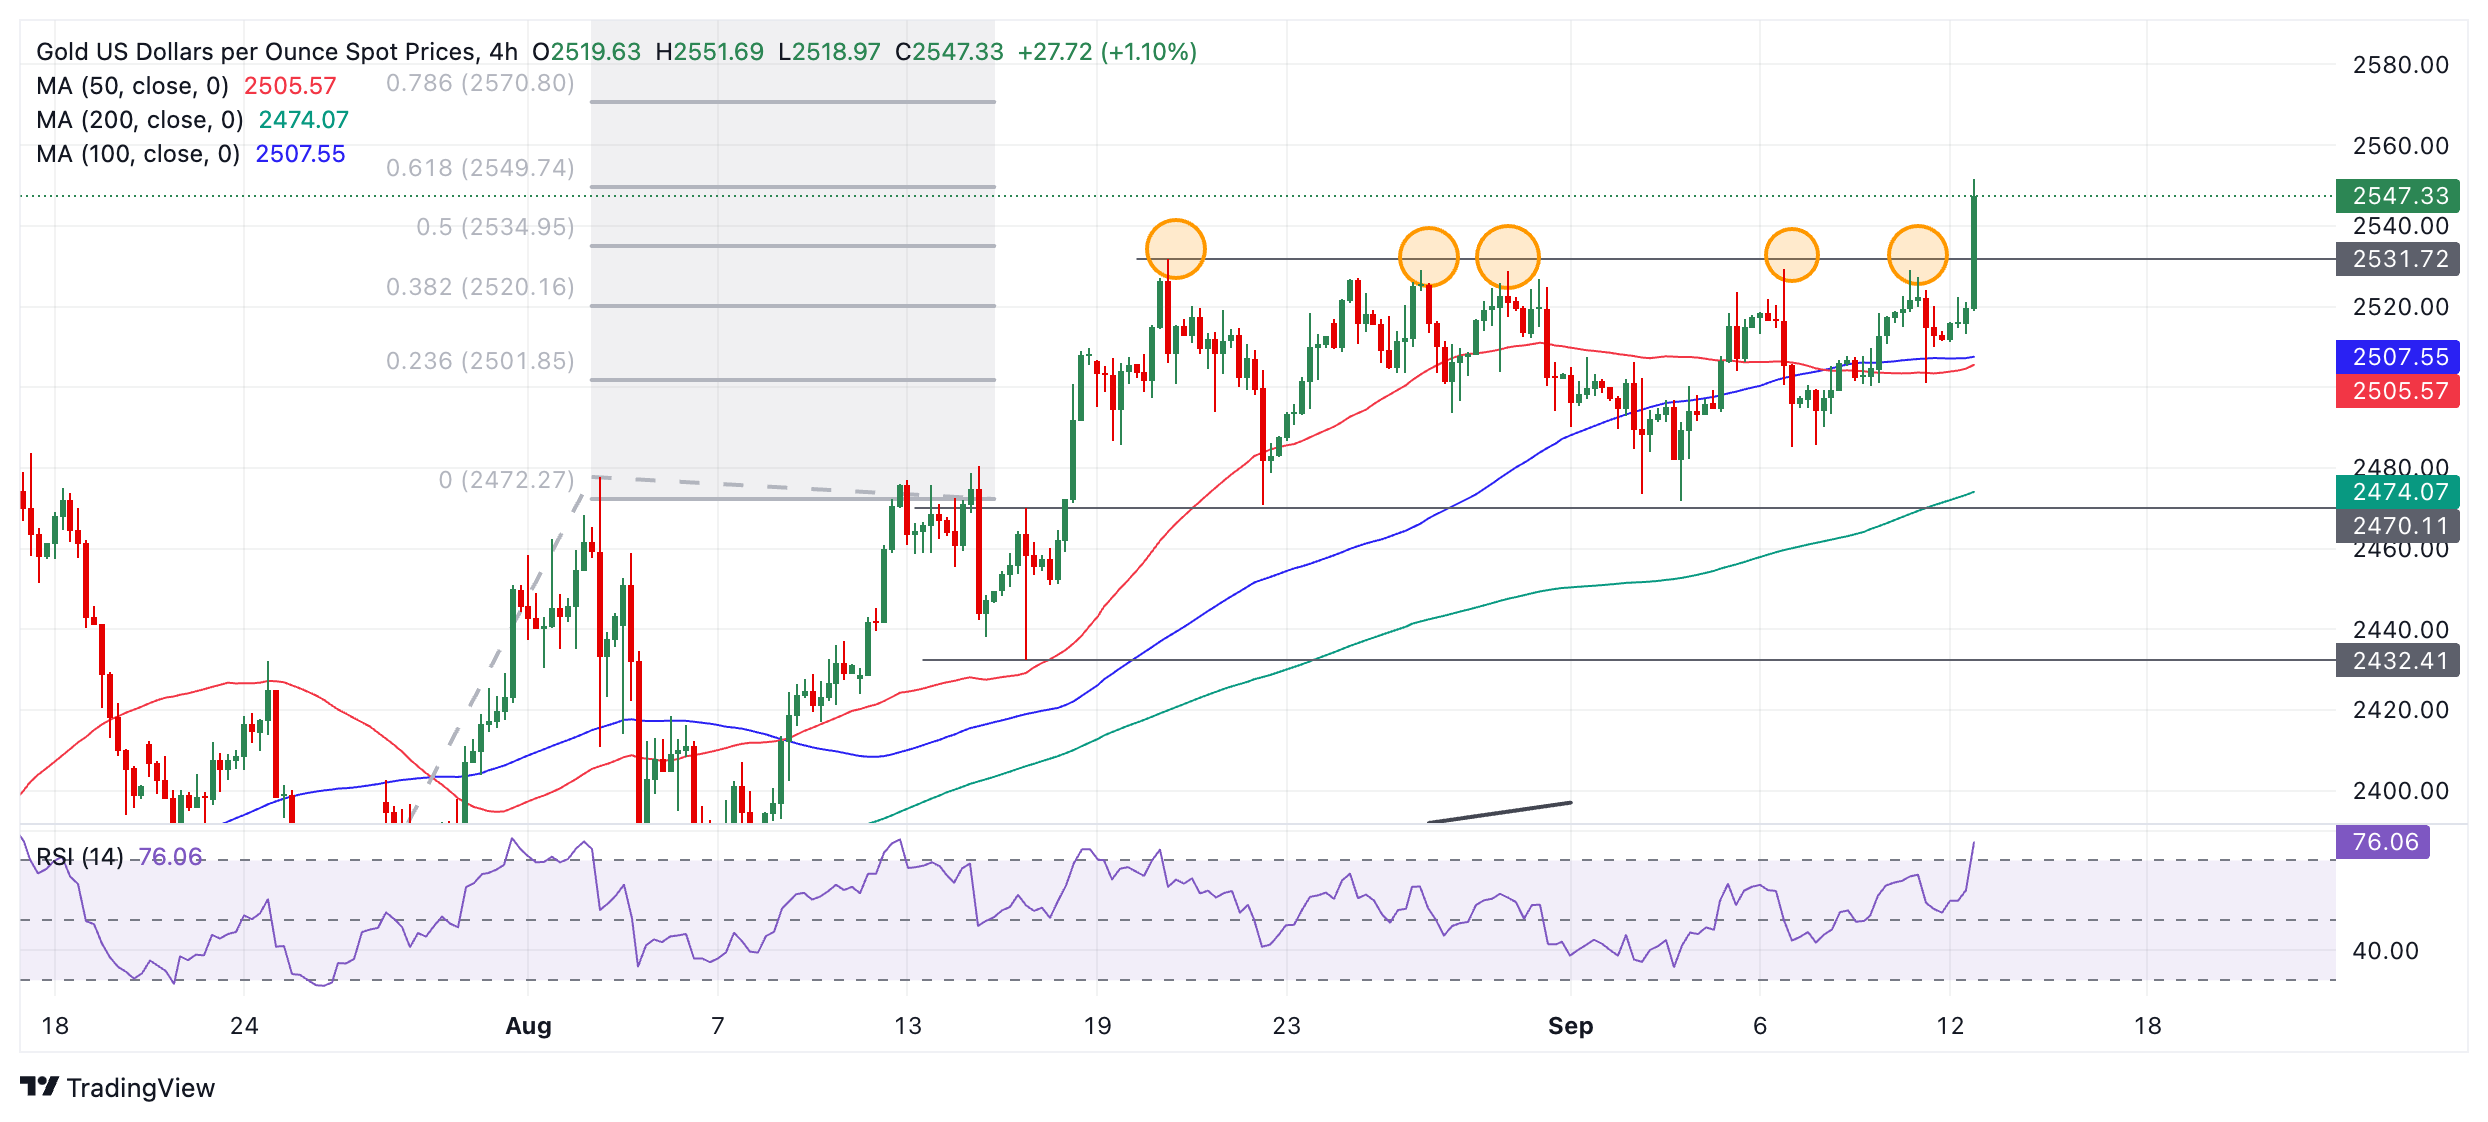
Gold (XAU/USD) breaks out of its multi-week sideways range and posts a new high for 2024 at $2,551 during the US session on Thursday.
XAU/USD 4-hour Chart
The longer-term trend for Gold is bullish, and since “the trend is your friend,” it will probably continuing rising.
Gold has now met its bullish target at $2,550, generated after the original breakout from the July-August range on August 14.
This opens the way to the next upside target at $2,570, the 0.786 Fibonacci ratio of the channel it was in previously, extrapolated higher.
Economic Indicator
Producer Price Index ex Food & Energy (MoM)
The Producer Price Index ex Food & energy released by the Bureau of Labor statistics, Department of Labor measures the average changes in prices in primary markets of the US by producers of commodities in all states of processing. Those volatile products such as food and energy are excluded in order to capture an accurate calculation. Generally speaking, a high reading is seen as positive (or bullish) for the USD, whereas a low reading is seen as negative (or bearish).
Read more.Last release: Thu Sep 12, 2024 12:30
Frequency: Monthly
Actual: 0.3%
Consensus: 0.2%
Previous: 0%
Source: US Bureau of Labor Statistics
Author

Joaquin Monfort
FXStreet
Joaquin Monfort is a financial writer and analyst with over 10 years experience writing about financial markets and alt data. He holds a degree in Anthropology from London University and a Diploma in Technical analysis.


