Gold touches down on 50-day SMA, finding a floor after US GDP-inspired sell-off
- Gold is bouncing off support from a major Moving Average after an over 1.0% fall.
- Traders now await the Federal Reserve’s preferred inflation gauge for more guidance on Friday.
- A lower-than-expected result could see Gold rebound; the opposite for a higher-than-forecast reading.

Gold trades in the $2,370s per ounce on Friday after recovering from the 50-day Simple Moving Average (SMA), as technical traders scalp the bounce after the steep drop of the previous day. Gold sold off by over 1.0% on Thursday as it ran with the commodity pack lower, which declined as a group on global growth fears.
Gold may be moved by Fed’s favorite inflation gauge
Gold could see more volatility on Friday after the release of June’s core Personal Consumption Expenditures (PCE) Price Index in the US, the Federal Reserve's preferred gauge of inflation. The data could further tone the outlook for interest rates in the US, which could impact the yellow metal.
The Fed is currently expected to cut interest rates by 0.25% in September, reducing them from an upper band of 5.50% to 5.25%. Two more 0.25% cuts are also seen as more than 50% likely before the end of the year, according to the CME FedWatch tool. The core PCE's last reading was 2.6% year-over-year in May, now economists expect it to fall to 2.5% in June as it edges ever closer to the Fed’s 2.0% target level. A deeper-than-expected decline would increase the probability of the Fed making further cuts to interest rates after September; the opposite is true of a higher-than-forecast result.
Overweight long-positioning and Asian demand stutters – TD Securities
Gold will probably continue to face pressure from the effects of overweight long-positioning and a fall in Asian demand, according to analysts at TD Securities. An imbalance of long positions that built up in the precious metal usually foreshadows a sell-off as markets rebalance, which appears to be the case with Gold.
"Macro trader positioning remains larger than warranted by rates markets' expectations for Fed cuts alone, with signs the Trump trade had contributed to some froth. Signs of a buyer's strike in Asia also emerged, as highlighted by the significant deterioration in the SGE premium and by nascent signs of liquidations from Shanghai's top precious metals traders," says Daniel Ghali, Senior Commodity Strategist at TD Securties.
Demand from Asian central banks, hoarding Gold to hedge against currency depreciation against the US Dollar (USD), has fallen due the recent weakening of USD and the appreciation of their own domestic currencies.
"Significant liquidations from SHFE (Shanghai Futures Exchange) Gold and Silver traders are now reinforcing the downside in price action, with more than 5t and 6.6m toz of notional sold over the last session alone. After all, if precious metal holdings were a hedge against Asian currency pressures, than the recent strength in Asian currencies is now playing in favor of continued downside," says Ghali.
Technical Analysis: Gold finds support at 50-day SMA
Gold continues unfolding a new down leg within the widening range it has formed since May. It is in a sideways rather than directional market trend, which, given “the trend is your friend,” is likely to continue.
The down leg has met support at the 50-day SMA at $2,360 and bounced slightly. If it closes below the SMA, it will probably extend its decline to the next support level at the base of the widening range and the 100-day SMA at circa $2,320.
XAU/USD Daily Chart
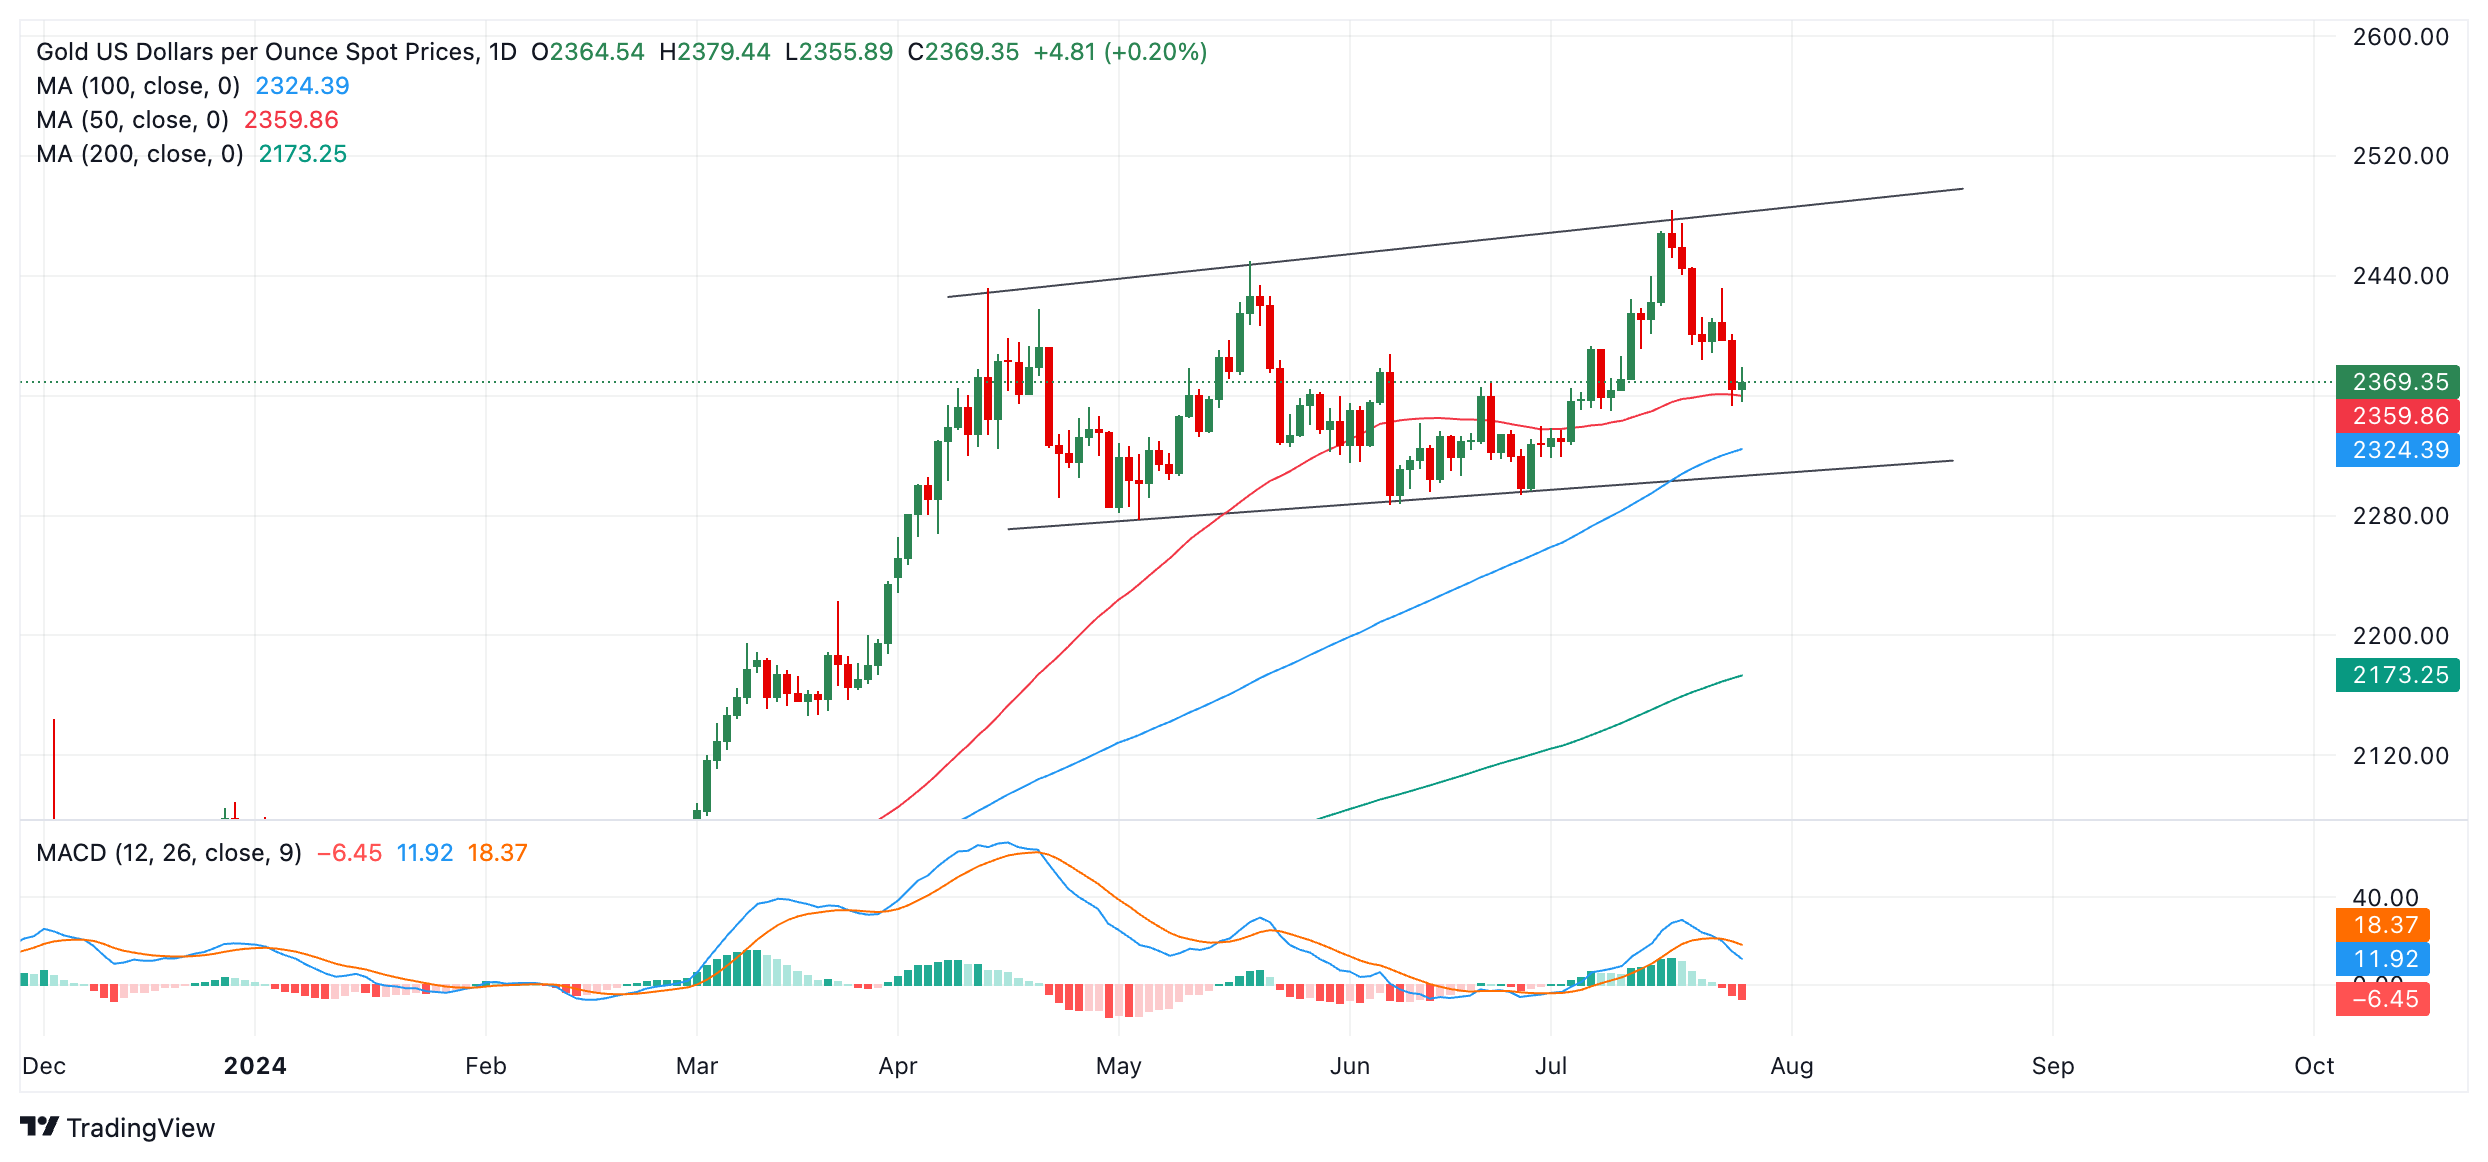
The fact that the Moving Average Convergence Divergence (MACD) indicator has crossed below its signal line adds further bearish confirmation to the downward move currently unfolding. MACD tends to work particularly well at signaling price turns in sideways markets.
A break above the $2,483 all-time high would indicate the establishment of a higher high and suggest the possibility of a breakout to the upside and an extension of the longer-term uptrend.
Such a move might unlock Gold’s next upside target at roughly $2,555-$2,560, calculated by extrapolating the 0.618 Fibonacci ratio of the height of the range higher.
Economic Indicator
Core Personal Consumption Expenditures - Price Index (YoY)
The Core Personal Consumption Expenditures (PCE), released by the US Bureau of Economic Analysis on a monthly basis, measures the changes in the prices of goods and services purchased by consumers in the United States (US). The PCE Price Index is also the Federal Reserve’s (Fed) preferred gauge of inflation. The YoY reading compares the prices of goods in the reference month to the same month a year earlier. The core reading excludes the so-called more volatile food and energy components to give a more accurate measurement of price pressures." Generally, a high reading is bullish for the US Dollar (USD), while a low reading is bearish.
Read more.Next release: Fri Jul 26, 2024 12:30
Frequency: Monthly
Consensus: 2.5%
Previous: 2.6%
Source: US Bureau of Economic Analysis
After publishing the GDP report, the US Bureau of Economic Analysis releases the Personal Consumption Expenditures (PCE) Price Index data alongside the monthly changes in Personal Spending and Personal Income. FOMC policymakers use the annual Core PCE Price Index, which excludes volatile food and energy prices, as their primary gauge of inflation. A stronger-than-expected reading could help the USD outperform its rivals as it would hint at a possible hawkish shift in the Fed’s forward guidance and vice versa.
Author

Joaquin Monfort
FXStreet
Joaquin Monfort is a financial writer and analyst with over 10 years experience writing about financial markets and alt data. He holds a degree in Anthropology from London University and a Diploma in Technical analysis.


