Gold recovers, boosted by soft US Dollar after US inflation data
- XAU/USD gains over 0.13% on Wednesday, rebounding from a weekly low of $2,605 due to a weaker US Dollar and declining US Treasury yields.
- US economic data show strength with the second GDP estimate for Q3 and strong labor market data.
- The core Personal Consumption Expenditures (PCE) Price Index aligns with expectations yet continues to rise.

Gold prices recover on Wednesday after dropping to a weekly low of $2,605, bolstered by a soft US Dollar responding to the release of US economic data. This alongside falling US Treasury bond yields, spurred Gold’s recovery to current prices. The XAU/USD trades at $2,636 up by 0.13%.
The market mood turned slightly sour as US equity markets prepared for Thanksgiving. In the meantime, the Federal Reserve’s (Fed) preferred inflation gauge, the core Personal Consumption Expenditures (PCE) Price Index, justifies the Fed's gradual approach, which is expected to lower borrowing costs at the December meeting.
Other data showed that the economy remains robust after the release of the second estimate of the third quarter's Gross Domestic Product (GDP). At the same time, jobs data revealed that the labor market remains strong as the number of Americans applying for unemployment benefits dipped below estimates.
Following the data, US Treasury bond yields fell, dragging the Greenback lower. The US Dollar Index (DXY), which tracks the performance of six currencies against the buck, tumbled 0.78% to 106.04.
Bullion prices recovered despite Lebanon and Israel agreeing on a ceasefire. Nevertheless, the escalation of the Russia-Ukraine conflict could keep buyers leaning into the non-yielding metal, which posted weekly losses of over 2.90% despite advancing on Wednesday.
According to CME FedWatch Tool data, markets now see a 70% chance of a quarter-point rate cut in December. The non-yielding metal shines in lower interest rate environments.
Daily digest market movers: Gold prices fluctuate near $2,630
- Gold prices recovered as US real yields dropped six basis points to 1.966%.
- US Durable Goods Orders rose by 0.2% MoM in October, missing the 0.5% forecast but improving from September's -0.4% decline.
- The second estimate of US GDP growth for Q3 came in at 2.8% QoQ, meeting expectations but below the 3% growth recorded in Q2 2024.
- Initial Jobless Claims for the week ending November 23 remained steady at 213K, below the projected 217K.
- Core PCE increased by 2.8% YoY in October, in line with expectations and slightly above September's 2.7%.
- Data from the Chicago Board of Trade, via the December fed funds rate futures contract, shows investors estimate 24 bps of Fed easing by the end of 2024.
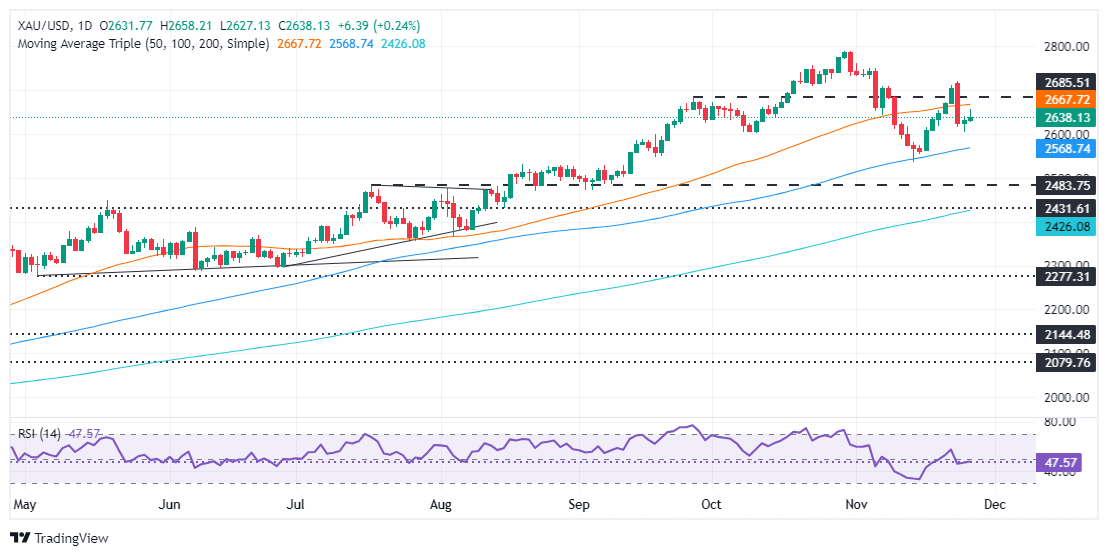
Technical outlook: Gold price advances modestly, clings to $2,630
Gold's price is neutral to downwardly biased after sellers pushed Bullion below the $2,700 mark. Although the golden metal pushes higher on Wednesday, the XAU/USD is carving out a series of successively lower highs and lower lows. However, if bulls reclaim the 50-day SMA at $2,667, this could pave the way to challenge $2,700, the psychological $2,750, and the all-time high at $2,790.
Conversely, If bears push prices below $2,600, it will open the door to testing the 100-day SMA of $2,568, immediately followed by the November 14 swing low of $2,536.
Oscillators like the Relative Strength Index (RSI) have shifted bearishly, indicating sellers are in charge.
Economic Indicator
Core Personal Consumption Expenditures - Price Index (MoM)
The Core Personal Consumption Expenditures (PCE), released by the US Bureau of Economic Analysis on a monthly basis, measures the changes in the prices of goods and services purchased by consumers in the United States (US). The PCE Price Index is also the Federal Reserve’s (Fed) preferred gauge of inflation. The MoM figure compares the prices of goods in the reference month to the previous month.The core reading excludes the so-called more volatile food and energy components to give a more accurate measurement of price pressures. Generally, a high reading is bullish for the US Dollar (USD), while a low reading is bearish.
Read more.Last release: Wed Nov 27, 2024 15:00
Frequency: Monthly
Actual: 0.3%
Consensus: 0.3%
Previous: 0.3%
Source: US Bureau of Economic Analysis
After publishing the GDP report, the US Bureau of Economic Analysis releases the Personal Consumption Expenditures (PCE) Price Index data alongside the monthly changes in Personal Spending and Personal Income. FOMC policymakers use the annual Core PCE Price Index, which excludes volatile food and energy prices, as their primary gauge of inflation. A stronger-than-expected reading could help the USD outperform its rivals as it would hint at a possible hawkish shift in the Fed’s forward guidance and vice versa.
Author

Christian Borjon Valencia
FXStreet
Markets analyst, news editor, and trading instructor with over 14 years of experience across FX, commodities, US equity indices, and global macro markets.


