General Electric Company (GE) Price Forecast: Technical view remains bullish

GE stock technical analysis
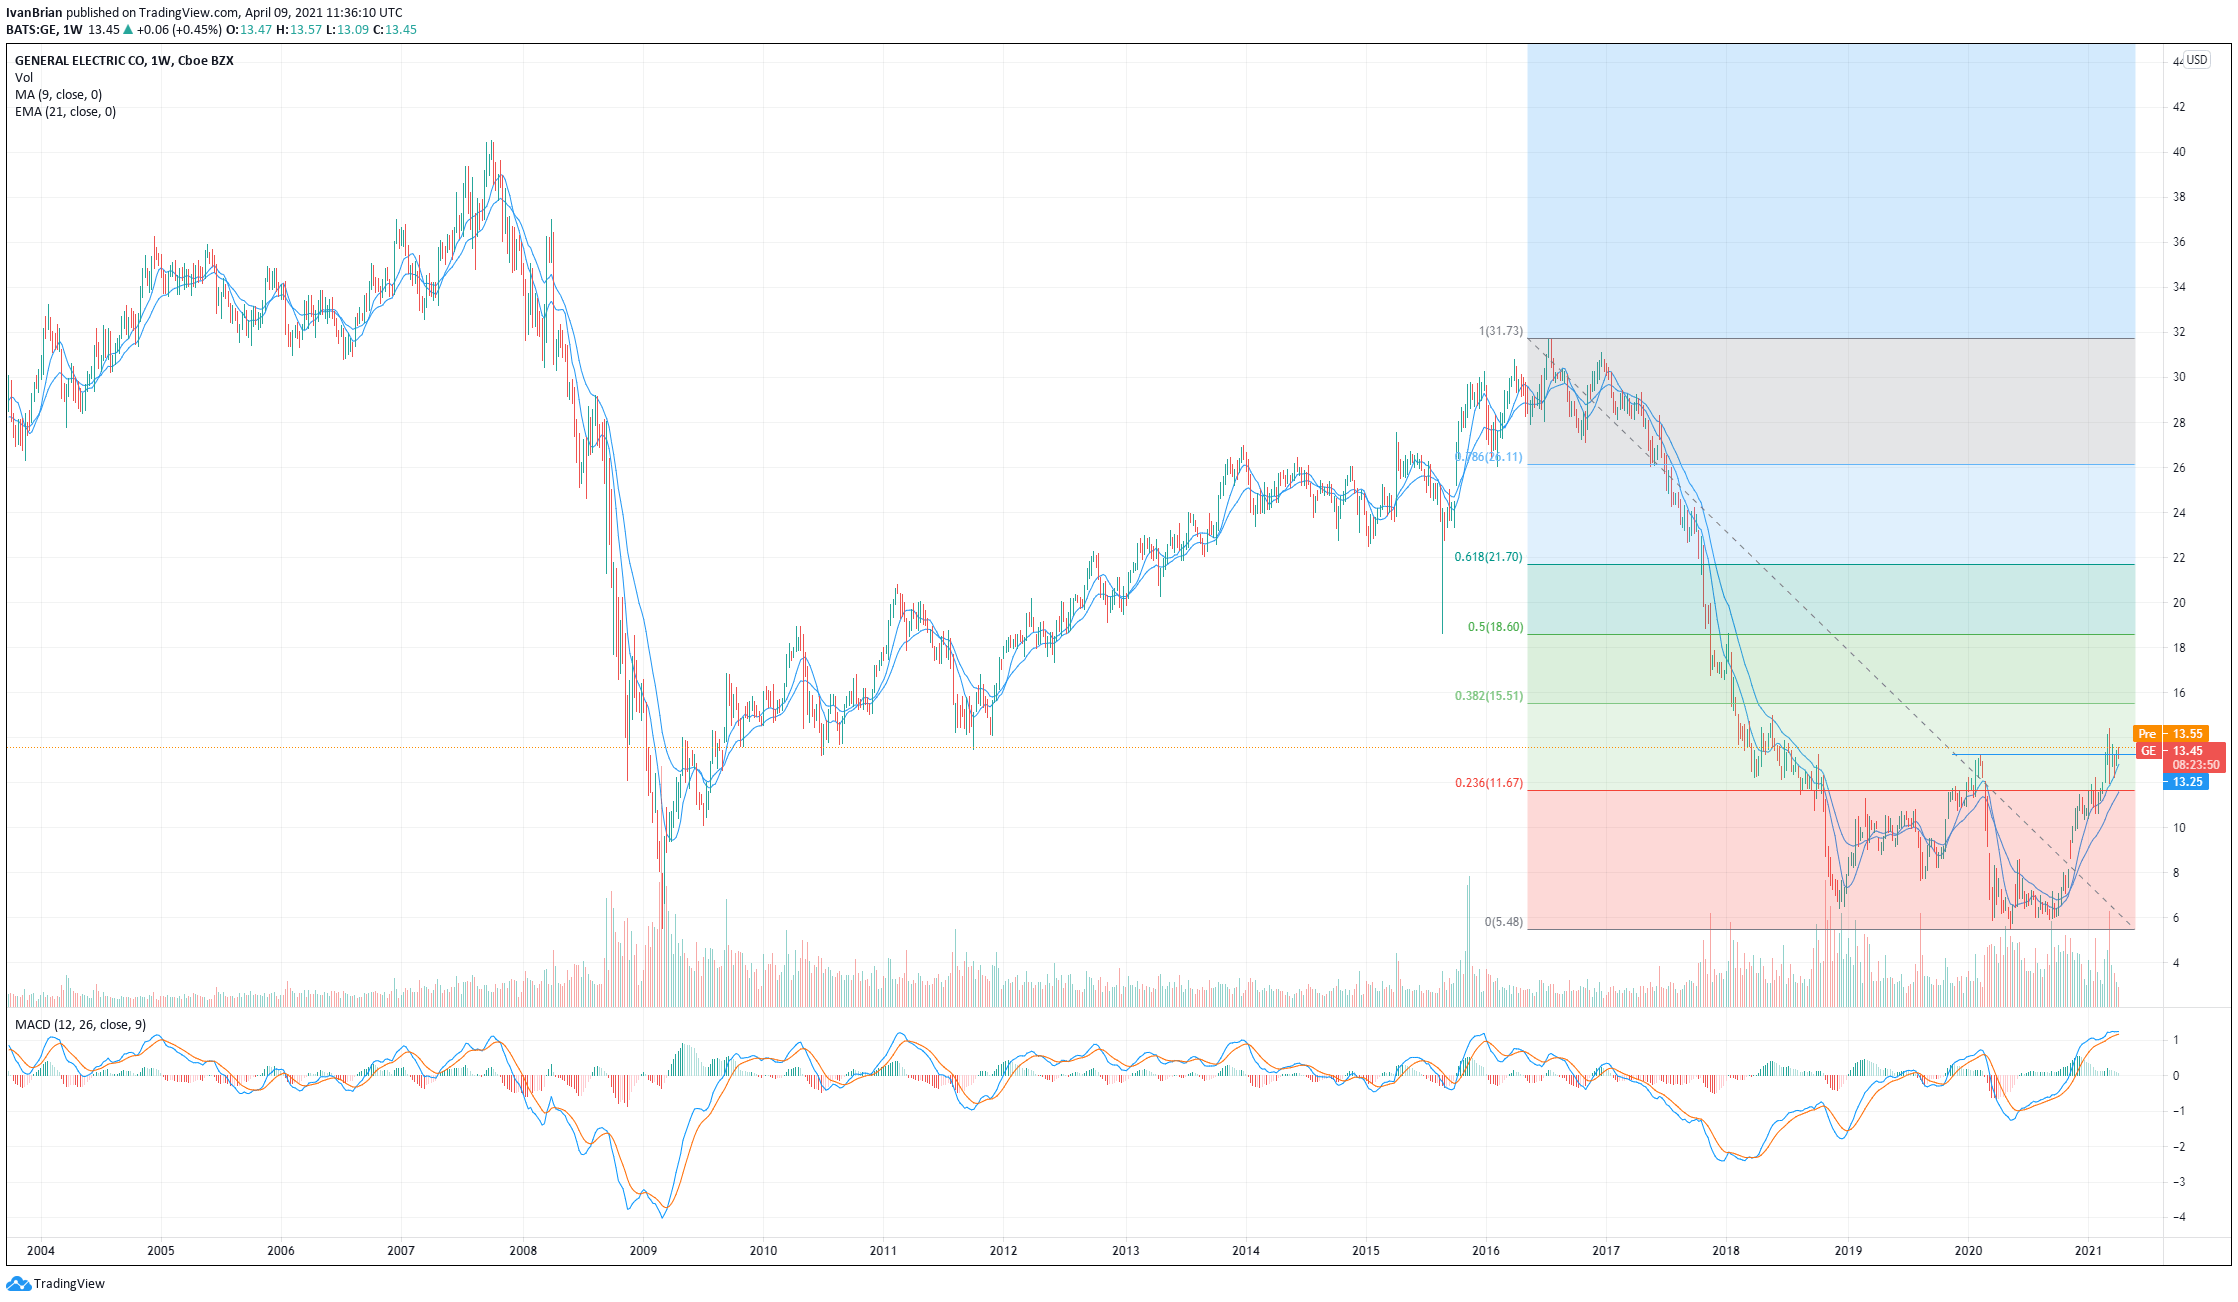
Taking a look at the big picture, we can see just how badly GE has performed over the last number of years. GE stock is a long way from its peak back in mid-2016 near $32. A steady downtrend appears to have bottomed out in the pandemic lows of 2020 and taking this move provides some nice Fibonacci retracement levels to aim for. $13.25 is the pre-pandemic high from February 2020, so ideally to remain bullish GE needs to stay above here. This brings $14.47 as the next target, which is the 2021 high thus far. A break here then brings the 38.2% Fibo retracement resistance into play at $15.51 and beyond $18.60.
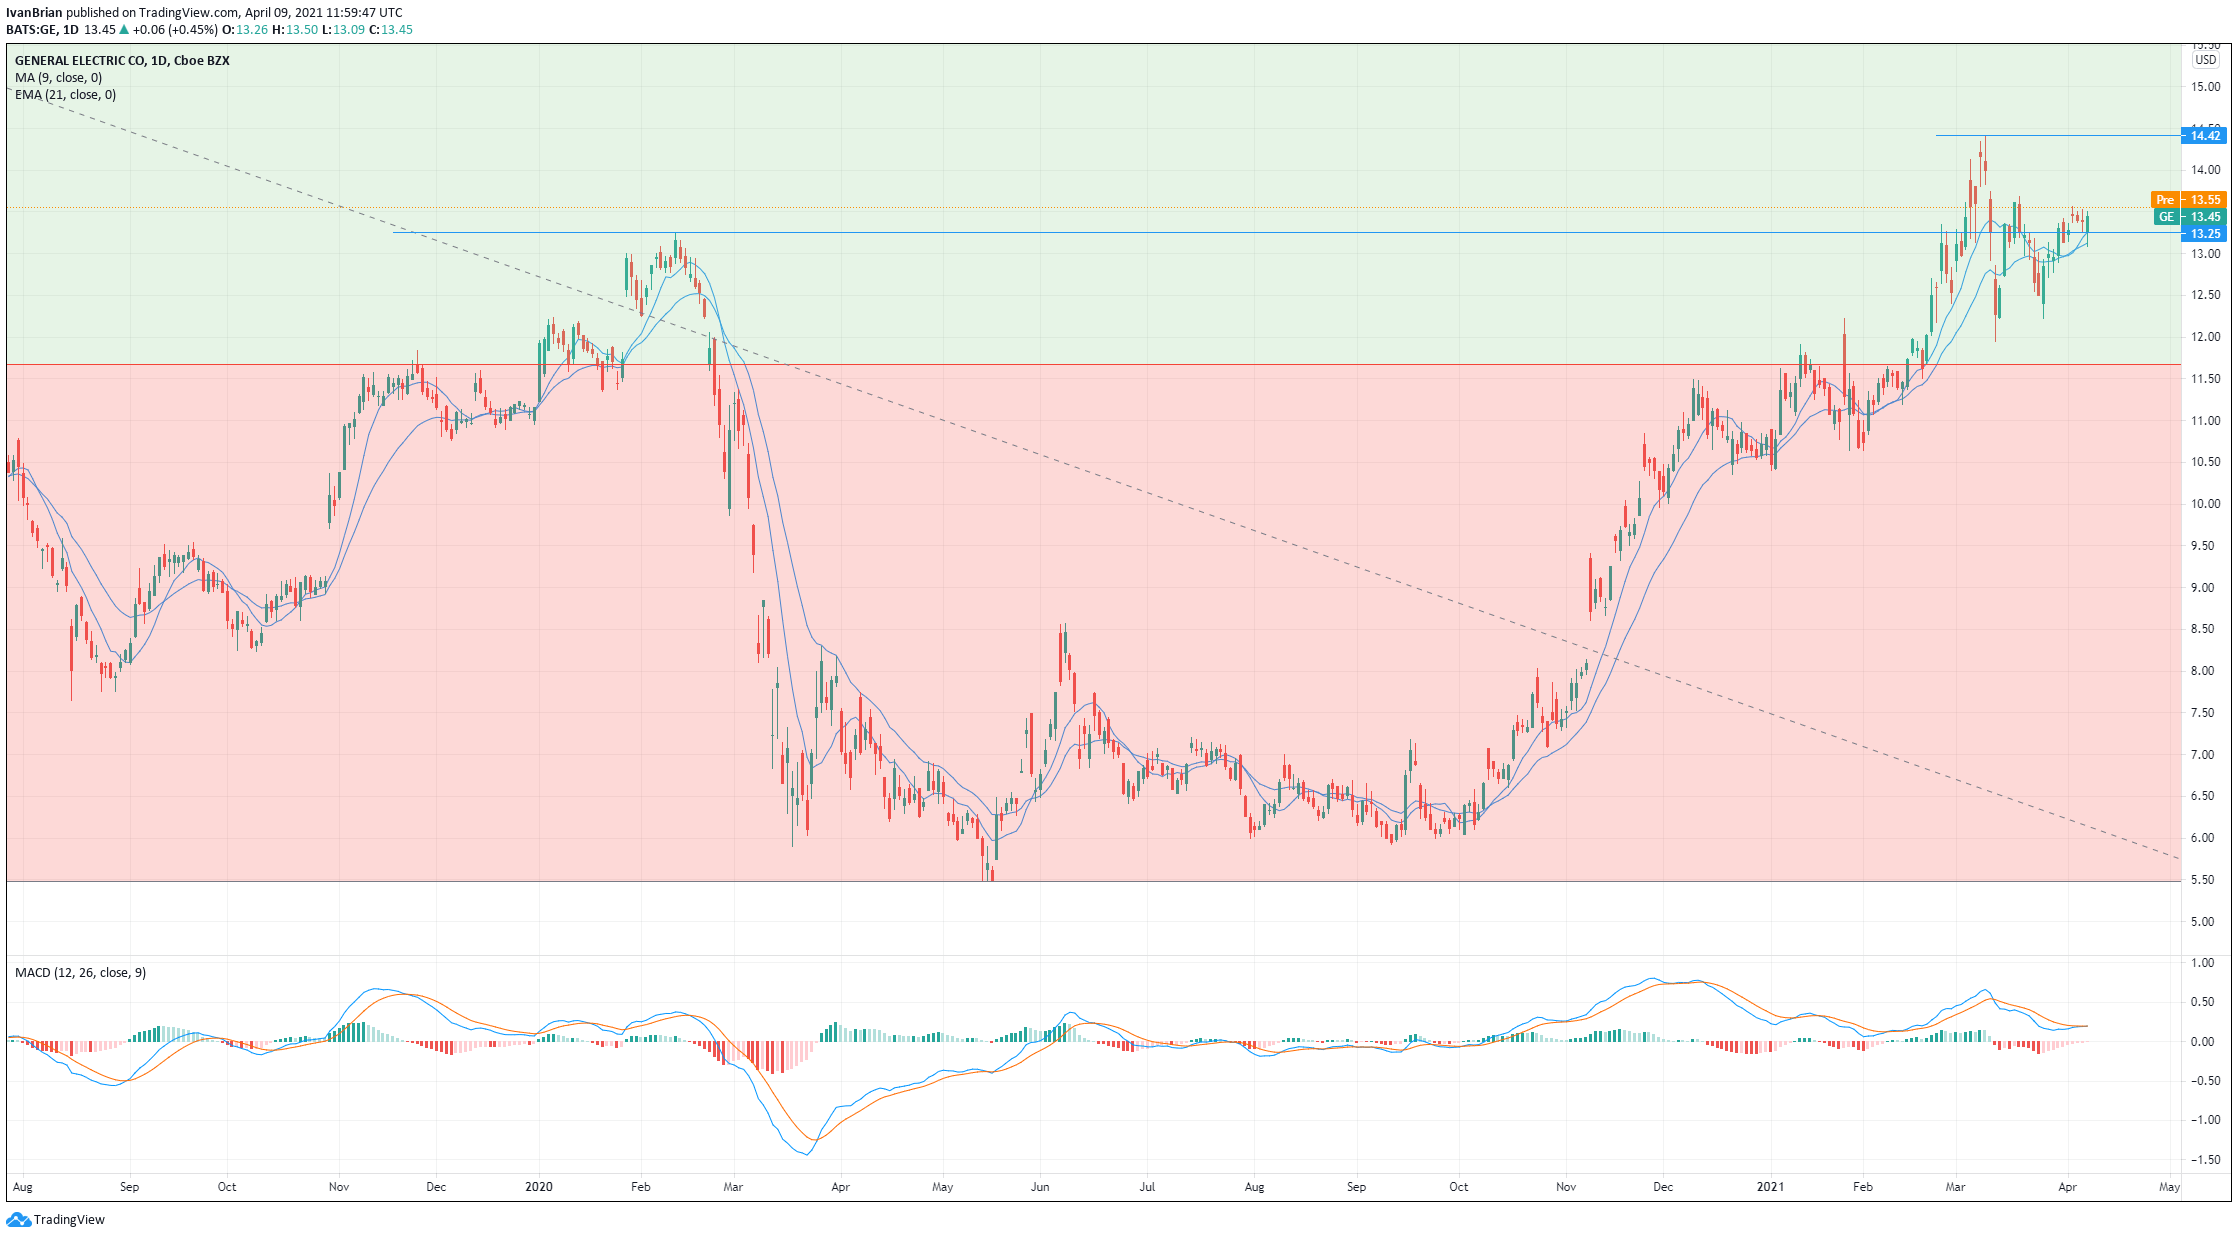
On the daily chart, we can see the key level to keep our bullish trend in place is $11.96, the low from March 11. Holding above this keeps the series of lower lows in place and confirms the bullish trend. The slight concern is the divergence of the Moving Average Convergence Divergence (MACD) indicator, which has yet to reach the highs from November 2020. The MACD is lagging, so it should catch up, providing the bullish trend stays intact.
9 and 21-day moving averages have held in the late 2020 rally and provide further support to the bullish trend. So long as GE stays above these levels, we can take bullish positions with stops just below the moving averages to manage our risk.
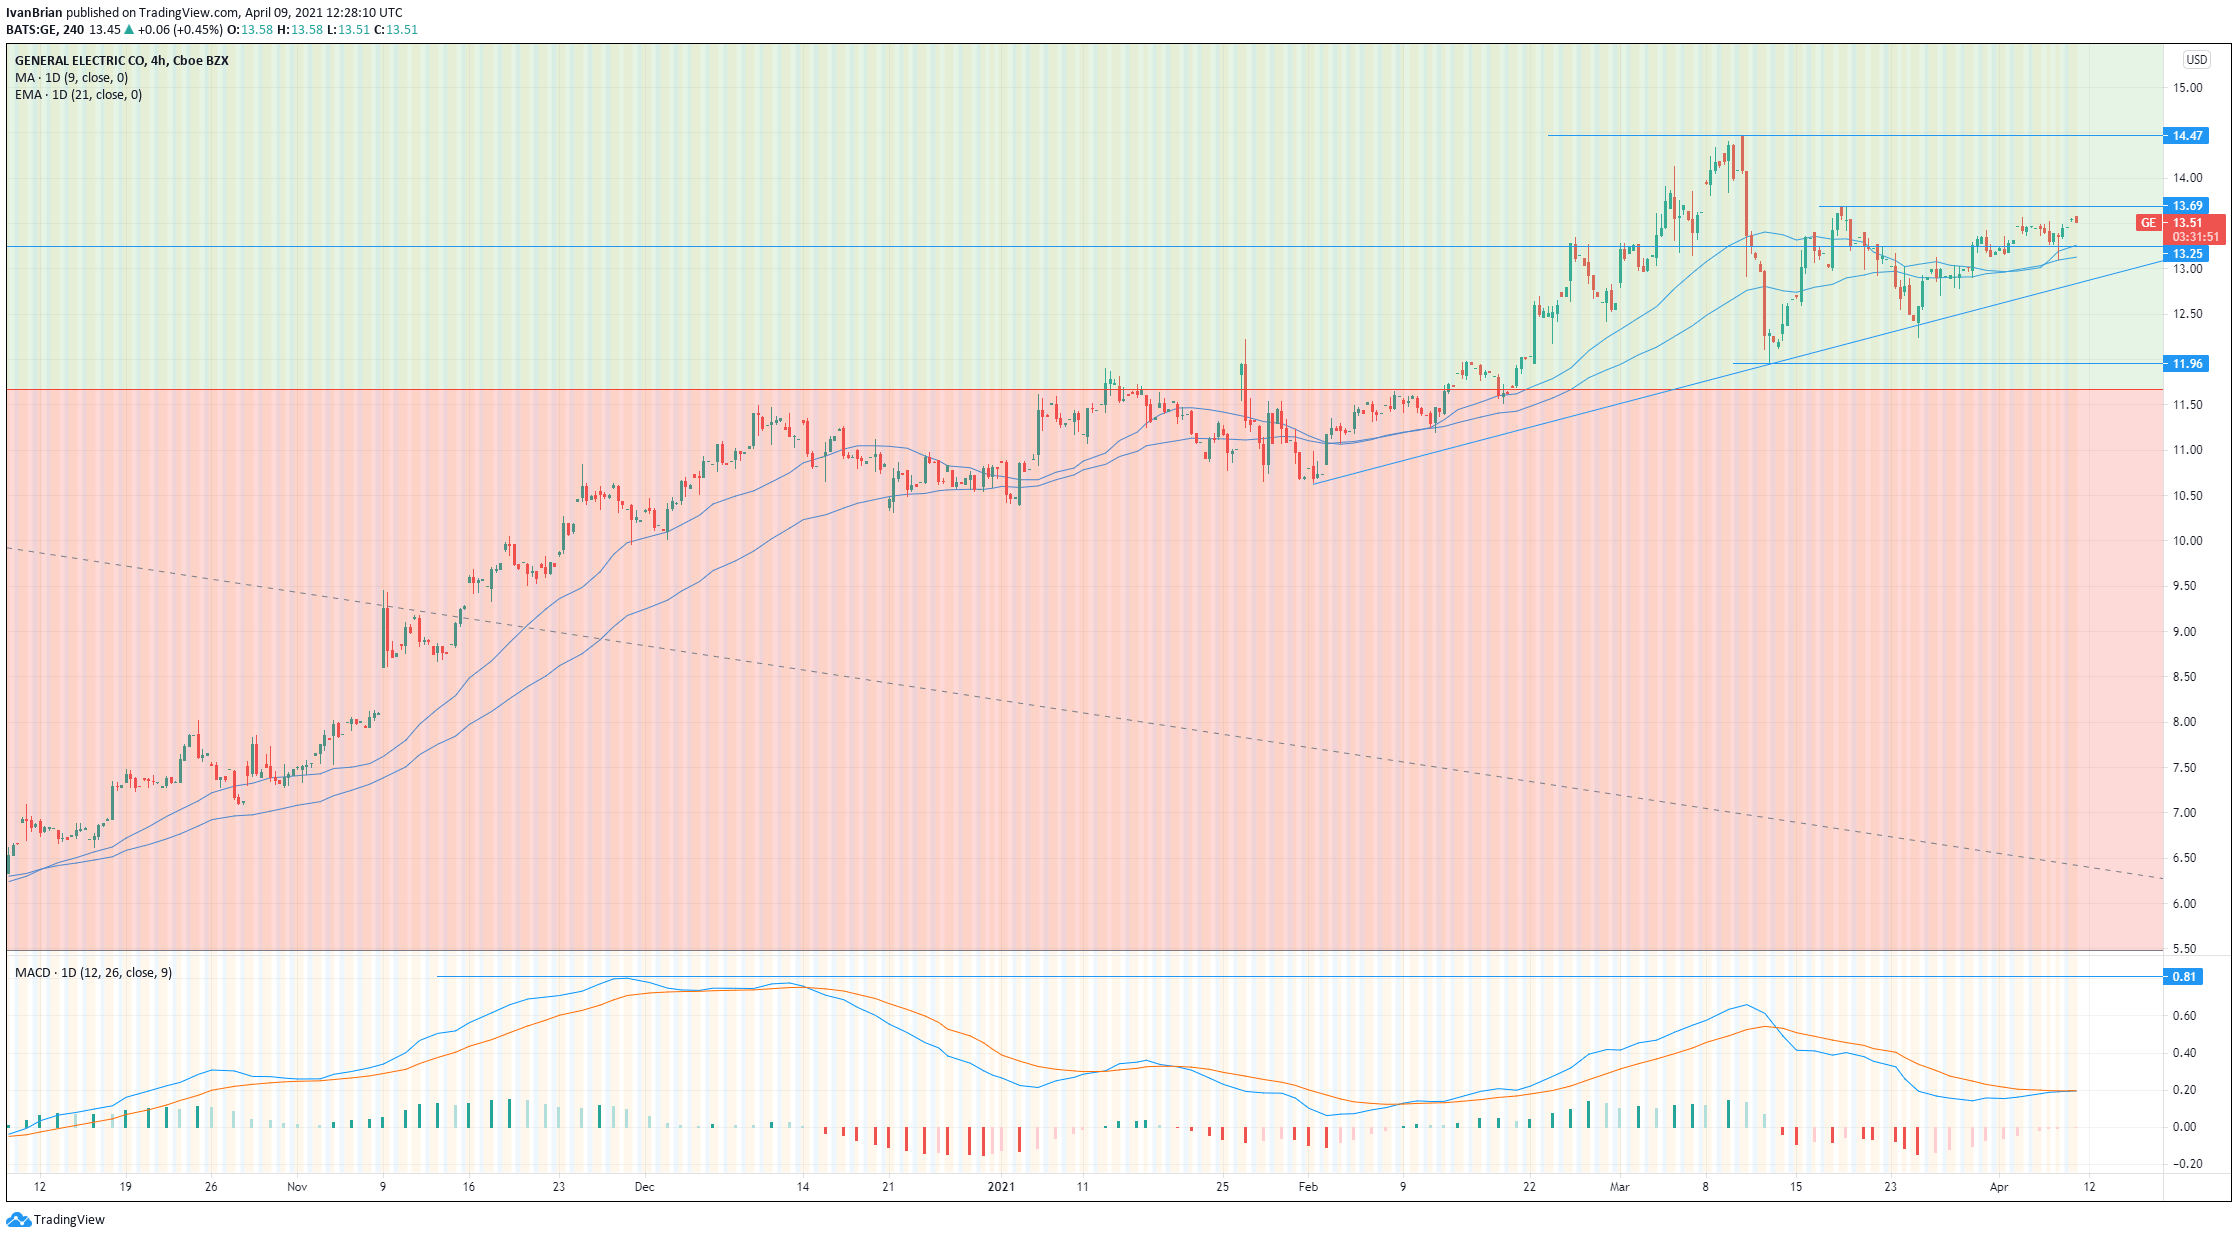
Traders taking a slightly longer-term, trend-following view may look for a pullback to the low $13 area or trade a breakout of the $13.69 high with confirmation and a further position at the break of $14.47.
The author has no position in any stock mentioned in this article and no business relationship with any company mentioned. The author has not received compensation for writing this article, other than from FXStreet.
This article is for information purposes only. The author and FXStreet are not registered investment advisors and nothing in this article is intended to be investment advice. It is important to perform your own research before making any investment and take independent advice from a registered investment advisor.
FXStreet and the author do not provide personalized recommendations. The author makes no representations as to accuracy, completeness, or the suitability of this information. FXStreet and the author will not be liable for any errors, omissions or any losses, injuries or damages arising from this information and its display or use. The author will not be held responsible for information that is found at the end of links posted on this page.
Premium
You have reached your limit of 3 free articles for this month.
Start your subscription and get access to all our original articles.
Author

Ivan Brian
FXStreet
Ivan Brian started his career with AIB Bank in corporate finance and then worked for seven years at Baxter. He started as a macro analyst before becoming Head of Research and then CFO.


